The students POV on interviews for internships & careers

The students POV on interviews for internships & careers

After the first round of the Baylor S3 Pro Day of virtual recruiting with 30 interviewers, 54 of the students rated each of the interviewers, selected their favorite two interviewers, and commented on one that didn’t go as well as hoped. After the second round of S3 Pro Days on March 5 (click here for more info), we will distribute information to interviewers (who also get the chance to rate the students on their interviewing skills). The S3 Best Interviewer Awards for S3 Sales and S3 Analytics will be announced for the S3 Awards Banquet on April 14.

These evaluations are much like teaching evaluations. We certainly prefer students enjoy the experience. Admittedly, sometimes learning experiences can cause user discomfort. So, good on you as professor or recruiter if you can do both: Supply enjoyable learning experiences that serve the welfare of all parties for both the short and long term. To that end, we offer 45 comments about what students liked best about interviewers, which thankfully outweigh the 24 comments on areas of improvement. Learn as you will from these.


Student POV

Interviews for Sports Sales & Analytics Internships & Careers


45 Areas of Excellence

1.       Intentionally listened and asked good questions.
2.       Asked very thoughtful questions and really answered my questions well.
3.       Most enthusiastic and didn’t make it feel like there was a power difference between him and me.
4.       Most willing to show me things like what they do in Tableau.
5.       Just fun to talk to.
6.       Really easy going and easy to talk to.
7.       They stood out above the rest for their openness while discussing their roles and the company culture at their respective teams. They came across as completely genuine, giving me their unfiltered opinions on their workplace instead of telling me any kind of pitch.
8.       Made me feel instantly comfortable during both conversations I had.
9.       Super genuine and friendly; They were not intimidating at all and very helpful in explaining their role and answering my questions.
10.   Very easy to talk to and did a great job answering any questions I had. I very much enjoyed talking and felt at ease and was disappointed when our time was up.
11.   Asked unique and challenging questions that kept me on my toes.
12.   Was genuine and kind while also getting down to business without any unnecessary conversation.
13.   Very personable and made a hectic time feel relaxed, calm and helpful. Made the conversation feel mutually beneficial which was great. Super informative and helpful.
14.   We had a really great conversation about just life. We shared a lot of similarities; was informational, and I got to walk through my resume.
15.   Took an interest in me beyond my job qualifications and wanted to get to know me better on a personal level. They made me feel like they wanted to speak with me and told me I could reach out any time in the future.
16.   Asked great questions and directed good conversation! Awesome at engaging and made me feel really comfortable.
17.   I was able to see how well they enjoyed not only working in their field but with each other too.  I also felt relaxed in the interview and it was one of the ones that I actually had fun being interviewed.
18.   They were the two most enthusiastic people I talked to.  I made really good connections with both of them. They also were very interested in making it clear that if I were hired that they would invest in my career to the fullest extent.
19.   Was very specific and had the 30 min interview laid out in sections of what to accomplish. I got to do a mock phone sale and a 45sec pitch.
20.   Genuine and engaging during our talk.
21.   Very open to answer any and all questions and truly share passion for the job and role as a manger. Provided an open and transparent look at goals for those new to the organization and what managers seek to get out of them.
22.   They made the conversations really smooth and easy and showed a genuine interest in me.
23.   Was very open and had great energy. Seemed very invested in our interview and even joked around a little bit. Overall a great interview and I was incredibly impressed with the organization.
24.   They gave great insights on what their companies did and gave in-depth analysis of the field of analytics, especially CRM and BI. Also, they made the effort to personally connect with me.
25.   Asked challenging questions and, in the interview, pushed me to do better. Charismatic and has good leadership.
26.   It felt like they were actually interested in getting to know me.
27.   They had amazing humor and personality and seemed really interested in talking to me! They acknowledge all of what I said and asked follow-up questions accordingly. They made the speed dating a lot of fun because it may have been an interview, but it seemed more like catching up with an old friend!
28.   Seemed very interested throughout our entire call and even asked for a second interview to better our connection in order to be a future reference for myself.
29.   Discussed the many ways they took care of employees during the ongoing pandemic, both with their mental health and with their paychecks. Detailed how the team handles the social issues that have become as prevalent as ever in recent times.
30.   Open, friendly, and honest. Made me feel more comfortable.
31.   Extremely genuine and excited to hear about why I want to get into sports. They asked very good questions and went into detail when answering questions that I asked about their organizations. Both came across as wanting to help me in my journey in any way they could.
32.   Very interested in me and my future goals, very engaging.
33.   Super high energy and gave me an awesome description of time with the team. Super helpful and seemed genuinely interested in my career growth.
34.   Asked questions about my personality and we were able to chat and have a great conversation!
35.   Gave me a whole lot of advice on how I could answer interview questions better. Offered to connect me with other people within the organization, which was awesome.
36.   Truly took the time to know me and understand what I was looking for in a future job opportunity.
37.   Very encouraging.
38.   Let us know that no matter what happens they were here to help us. Even if that means we go for a decision and it does not include their organization. That is admirable.
39.   Took the time to know me knowing that I am only a sophomore yet was intrigued when looking at my LinkedIn profile. So kind and just wanting to help.
40.   Extremely kind, was prepared with knowledge about me, insightful answers to my questions, willing to help, relatable.
41.   Very interested in what I had to say and gave me great advice.
42.   Very kind and helpful.
43.   Gave great advice, flowing conversation, tremendous insight into job and analytics in sports. Willing to help.
44.   Seemed very genuine in wanting to get to know us. Gave me some valuable advice and perspective.
45.   We had a fantastic conversation about the importance of mental health in the workplace (and in general) and the emphasis put on it.

24 Areas of Improvement

1.       Really didn’t have much of an interview experience. It was too casual.
2.       Questions were very vanilla. Couldn’t get a good read off them.
3.       Didn’t really seem like they wanted to be there.
4.       Wasn’t easy to talk to.
5.       I sort of felt like I had to lead the conversation, where with the other recruiters, they were the ones guiding it.
6.       Seemed not to take our 10-minute call seriously. Never made eye contact and was constantly looking around the room. Gave cookie-cutter monologue and nothing more.
7.       Asked very structured concrete questions. I heard from others that they kept people over time and shorted others. Didn’t appear open.
8.       Informational but it was very cold. It wasn’t a natural conversation like the rest of my 10 min talks.
9.       Rapid fire questions, less conversational interview (granted, we only had 10 minutes).
10.   Asked a lot of questions that didn’t pertain to anything important and also not related to S3 or internships.
11.   Did not feel a connection with the organization or interviewer specifically.  Nothing against, is a great person.  I just did not find myself enjoying the interview or the chemistry.
12.   A stand-in for my interview didn’t seem too ecstatic to be there. Seemed very dry.
13.   Not very engaging and didn’t show a lot of emotion.
14.   Had one short interview where I was asked very off-topic and slightly offensive questions.
15.   I was confused on the style of the interview. Seemed harsh.
16.   Seemed very distracted; like the focus was elsewhere from the start. It threw me off a little bit and it felt like we never really got into the interview at all.
17.   Didn’t have a lot of emotion and didn’t seem that interested in talking to me. It felt like more they were just doing this to put a check mark on their calendar.
18.   Felt more like an actual interview and less of a conversation. It was intense, which is fine, but I enjoyed some other conversations more since they were more chilled.
19.   Conversation was not engaging and was not very interested in me or what I was saying.
20.   Didn’t really seem very interested in being at the event. Wasn’t super open about time with organization, which made the interview pretty difficult to stay engaged with.
21.   Not all that open to talking much about the organization and the conversation was hard to get through.
22.   Impersonal and mechanical conversation. Improved in the second round of interviews but felt like they were checking boxes rather than trying to make a connection or be a resource.
23.   Typing the entire time.
24.   It was so awkward; I was given short answers to questions that I asked.

How Sales Management in Pro Sports Can Catch Up to Corporate America

Why do parents, teachers, politicians, managers and salespeople continue bad practices? Four reasons and the ways we express them are:

  1. We do what was done to us and assume it was best practice.
    • “Look at me, I turned out OK didn’t I?”
  2. We lack the depth and breadth of relevant education to recognize bad practices.
    • “See, you can succeed with any background!”
  3. We judge outcomes based on the exception rather than the rule.
    • “Look at her, she started here and is now vice-president!”
  4. We lack the courage to meet the demands of reality.
    • “I know this isn’t working, but I can’t change what I’m doing now.”

Sports sales recruiters often ask applicants, “Why do you want this job?” The wrong answer is, “I just love sports.” The irony is when it comes to pay, work hours and benefits, they literally bank on the applicant’s love for sports to compensate for, well, real compensation.

How Do We Know the Sports Sales Management Model is Broken?

Sales 101

First, consider some basic 101 principles of sales management. These quotes are directly from a leading sales textbook 1

  1. To attract and keep the best talent compensation must be uniform within the company and in line with what competitors’ salespeople receive.
  2. Salespeople who perceive the system as unfair may give up or leave.
  3. A constantly changing system may lead [salespeople] to constantly change their activities but never make any [more] money.
  4. Companies that do not emphasize service or do not anticipate long-term customer relationships typically rely heavily on commission plans.
  5. Salespeople working primarily on commission have little company loyalty and certainly are less willing to perform activities that do not directly lead to sales.

Inside sales reps in sports do not receive compensation in line with what they can get anywhere else. Top salespeople often see the system as unfair (given effort & reward) and leave as soon as a client sees how good they are (and offers multiples of current pay). Teams frequently “play with the lights” changing compensation systems in ways that rarely favor the rep by making the rep more money. The shift toward service-only reps leaves inside sales reps relying heavily upon commission and sacrificing customer welfare and service. As a result, few have loyalty and are certainly unwilling to do non-sales related activities.

Turnover

Second, consider the effects and costs of turnover. Average sales turnover across industries annually hovers around 25%. 2 Typical sports sales practice is to recruit a new class of inside salespeople every 4-6 months, suggesting something closer to the average turnover among car salespeople (~70-75%). 3 Some are promoted (internally or externally), but most leave the industry voluntarily or involuntarily.

Costs of turnover are estimated between $75,000 to $200,000 per salesperson4, taking into account recruiting, training, and lost sales. You can calculate yours here. The NBA estimates third-year reps generate 3.4 times the revenue as first-year reps. Unfortunately, relatively few get to the third year.

If I fail over half of my students each year, you wouldn’t say I’m a good teacher. In our program, we can’t blame the students. We recruited them. The same is true for teams. If annual turnover is anything much more than the non-sports corporate average (25%), at some point we must have the courage to start looking at the system and grasp the reality.

Training

Most sports sales managers are interested in training. The problem is the low proportion of these with any professional training in personnel management, compensation structure, leadership, and other sales management responsibilities. Many make great effort to learn to compensate for the lack of formal training (i.e., business management-related degrees). A few have had professional selling courses. A few have MBAs. Most were selected on the basis of being great salespeople, rather than management skills–which are two quite different things.

Sales students not taking the sports route are often hired by companies like Oracle, IBM and other major corporations who offer starting pay closer to $100,000 than $30,000, even while spending months in training before ever making a sale. We don’t expect teams to be on par with Oracle. But, $10-$20 an hour and first year commissions won’t attract the best talent among graduates who just spent tens or hundreds of thousands of dollars getting an education and accruing student loans.5

A New Model

Sales executives and managers (in sports) routinely bring in motivational sales speakers and hold weekly pep talks. Why? Because the nature of the role and associated benefits of the job aren’t intrinsically motivating on their own merits.

One of our partners, Spurs Sports & Entertainment, decided to do something about it with the support of leadership, including Frank Miceli and Tim Salier. Lindsay Beale, Director of Business Development at SS&E, walks us through the four steps they undertook.

Step 1: Look at the hard truth

We studied our sales work force and realized we were recruiting talent, investing resources into their professional training and development and they were leaving our organizations for other local corporations in sales roles.  We thought we had the hiring and recruiting figured out. We found individuals who really wanted to sell. For years we felt our compensation was competitive to other sports organizations. This helped with recruiting, but when you hire talented salespeople, they have opportunities outside of the sports & entertainment business.

Corporations look for talented salespeople from reputable organizations. They use aggressive recruiters, signing bonuses, high base salaries and competitive compensation packages to attract them.  We realized we couldn’t compete with them–specifically with our representatives with under 3 years of tenure.

We worked with finance and HR to evaluate our current sales structure to establish a plan to address our top concern of retention.  Through our research it was also clear compensation wasn’t the only place sports sales are behind the corporate sales world.  We are currently in the process of addressing sales retention by reviewing three areas: compensation, sales enablement and culture.

Step 2: Create competitive compensation

Teams may think their compensation is competitive with other teams, but that is the wrong comparison point if the goal is to retain talented salespeople. We restructured in four ways.

  1. Supplement commission in the first few years with a higher base salary to provide stability while the sales representatives build their books of business. [Among S3 partners moving in this direction, this ranges from $30,000 up to $42,000 for base pay.]
  2. Restructure commission to reward all sales revenue. We realized our commission structure heavily rewarded products that more tenured representatives were selling but weren’t incentivizing newer representatives.
  3. Provide a strong upside for top sales representatives, with clear rewards and recognition for high achievement.
  4. Hire sales representatives at a full time, full benefits position. No seasonal positions.

Step 3: Give them the tools

We established a Sales Enablement strategy applying digital tools, analytics and strategic processes to allow our sales team to excel in their jobs.

  1. Utilize data and analytics.
    • Lead Scoring
    • Appending data to sales leads to target individuals for specific campaigns
      • Examples: Outer markets for weekend plans or high net worth individuals for premium events.
  2. Invest in technology to improve sales efficiency.
    • Conversica, artificial intelligent sales assistant
    • Zip Whip, texting platform
    • ZoomInfo, business to business prospecting tool
    • Linked-In Sales Navigator
  3. Train and develop adaptive selling skills.
    • SS&EU: Classes are offered during work hours, are hands-on, and cover a variety of topics. They are facilitated live by in-house experts to encourage the cultivation of ideas and relationships across departments. SSEU is supported at the highest level of the organization and every executive teaches a different course.
    • Internal and external sales trainers
    • On the job sales training

Step 4: Create a people first culture. Really.

  • Provide a clear path for internal promotions.
  • Recognize each seller has an individual selling style. Coach, develop and set metrics to fit each representative.
  • Promote work life balance for everyone.
    • Eliminate the following phrases from management vocabulary:
      • Grind.
      • First one in, last one out.
      • Outwork everyone else.
    • Focus on quality of work and their commitment to the sales process, goals and team.
      • Commitment (you want) vs. Compliance (you must)
  • Allow flexible hours that still meet business needs.
  • Increase self-empowerment. Encourage reps to make their own decisions on how to manage time and activities to reach goals rather than micromanage to the numbers.
    • Coach reps to improve each day and strive for stretch goals they set for themselves.

Conclusion

We believe the S3 program can recruit more and better talent to the major the more teams buy into the new model aimed at development and retention. Just because teams can recruit people to fill each sales class with low wages and benefits doesn’t make it the right thing to do–either for the candidate or the team’s welfare. Basic sales management principles show us how we can do better.

Some teams are taking the lead. Since word has gotten out, others have reached out to say they are following suit. Do you want to join them? Are you in?

  1. Selling: Building Partnerships, 2014, Castleberry & Tanner, New York: McGraw-Hill. Quotes straight from the book are in italics.
  2. https://www.ringdna.com/blog/work-to-retain-sales-reps.
  3. https://www.wardsauto.com/dealer/maxdigital-out-stem-74-turnover-rate-among-dealer-salespeople.
  4. Sales Management: Analysis & Decision Making, 2012 Ingram et al., London: Sharpe.
  5. Even if it isn’t a private school (average ~$35k/year), public school still costs at least $10k/year for tuition/fees alone.

Do MLB giveaways and special events influence attendance?

Do MLB giveaways and special events influence attendance?
by Kirk Wakefield – October 2018

Forbes reported before the 2018 season started that clubs planned over 1800 special event promotions, including about 28 giveaways per team on average. The Cardinals (49), Dodgers (42), and Cubs (41) all topped 40 giveaways. The Marlins (11), Athletics (14), and Diamondbacks (15) were the least giving. If you’re already seeing a pattern, you may be onto something.

Not everyone follows MLB attendance with the same passion as I do. I’ve been tracking and analyzing MLB attendance trends decade by decade since 1990. In the 1990s and early 2000s, it was the rash of new stadiums drawing fans to the game. As we move into the current decade, the strongest predictor of attendance is the presence of star players (represented by total payroll) and the fact that each new year brings overall lower attendance. Winning has always been important, but always behind star power and stadium-related factors (including capacity). Ticket prices, as we’ll see shortly, rarely influence annual attendance. Instead, we can reliably predict next year’s prices based on this year’s attendance.

What about giveaways and special events?

We don’t have historical, annual data on the number of giveaways and special events offered by team. But, thanks to Forbes, we have them for 2018.

It’s not enough to ask, “Are more giveaways and special events correlated with attendance?” You must account for anything else that might influence attendance. Thankfully we did this for you.

To explain average attendance (right) we include the following factors for each team:

  1. Total payroll in dollars
  2. Won/loss percentage
  3. Stadium capacity
  4. Special Events
  5. Giveaways
  6. Population/Franchise Index 1
  • Fan Cost Index (see Team Marketing)
  • Park factors: Runs scored; Home runs


The results

We can explain 91.3% of the variance in attendance with these factors. If you think that is high, you are correct. We rarely explain over 90% of anything. If you’d like to play with the data yourself, click here to download. 2

We numbered the factors above for a reason. They represent, in order, those factors with the most influence on attendance. Total payroll (B = .411), winning (B = .328), and size of the stadium (B = .313; i.e., bigger stadiums like the Yankees and Dodgers) each strongly predict average attendance.

Special events (B = .224) and giveaways (B = .198) significantly influence attendance (p < .05). But, not so fast. We took a deeper dive on the relationship of giveaways on attendance. The relationship is not linear.


As most readers likely guessed, what we see is the classic sideways-S curve of a cubic function. Ok, maybe you don’t hit these kinds of curves very well. But, you can see from the graph that teams offering few giveaways (e.g., Marlins and A’s) fared poorly.  As teams offer 10-20 giveaways, attendance increases. However, the dip in the curve shows a good many teams with 20-40 giveaways actually decrease in attendance. This is bad.

What is good? Going all out. The teams offering 40 or more fared very well. This finding is consistent with the philosophy of making the big even bigger. Rather than using promotions only to shore up lousy games, make the big game weekends too big to ignore. The spillover excitement offers a windfall to attendance overall.

What is better? More giveaways and special events give fans more reasons to go. Without, you’re just selling baseball. With, you’re selling entertainment. Want baseball fans to bring less motivated family members and friends? Give them a reason. Many reasons.

The unconvinced are saying, well, those are the Dodgers, Cubs and Cardinals. They have bigger or better stadiums, or winning teams, or maybe bigger markets. We accounted for all of that, remember? These numbers don’t lie. The number of giveaways explain or predict attendance (apart from everything else), and the effect increases at an increasing rate.

Conclusion

The results also show that special events significantly increase attendance. Teams like the Padres (172), Brewers (136), and Royals (126) benefitted from these appeals to different market segments to increase attendance above what it would have been without them. We can argue those with the fewest special events (Red Sox, Mets & Yankees) didn’t need them because of the other factors going in their favor. What might they have done with them?

Finally, it’s always interesting to note the cost of going to the game doesn’t influence average attendance. Neither did any of the park factors, like runs scored or home runs. The total market size and inter-city rivalries help attendance, but just as it has from 1990-2015, it is the least (although significant) effect.


  1. The PFI accounts for larger markets + total major league franchises in the DMA. The New York teams lead the way with the largest population and the most (9) major league teams.
  2. To get 91.3% R-Squared you need to include the quadratic and cubic functions for giveaways.

Are Silicon Valley Teams as Data-Driven as You’d Expect?

Are Silicon Valley Teams as Data-Driven as You’d Expect?
by Brad Sherrill – October 2017

With Apple’s headquarters right down the street, you would expect the teams in Silicon Valley to be digitally-savvy and data-driven. We were not disappointed, as the teams from San Jose demonstrated how they employ business intelligence to generate revenue.

Sharks Leadership Analytics-Driven

Flavil Hampsten, Executive Vice President & Chief Marketing Officer, began honing his sales & marketing analytic skills to drive revenue while completing his MBA at Arizona State in 2009 and serving as Vice President of Ticket Sales at the Phoenix Coyotes, before heading to the Charlotte Hornets and now back in the NHL at the Sharks. Neda Tabatabaie was brought in at the Sharks to implement a cohesive data strategy when Mr. Hampsten arrived in 2015.

CRM Boosts Sales

S3 graduate McKenzie Bryan said, “I really enjoyed hearing from the Sharks on how well they integrate CRM/Analytics into the sales department and all of the ways a solid CRM system helps sales.” The Sharks organization encourages utilization of CRM to achieve more efficient and effective sales numbers. Beyond this, however, the Sharks want salespeople to be analytical and intentional as they attempt to make connections with current and future fans.

[slideshow_deploy id=’10035′]

49ers Commit Headcount to Analytics

Hayley Di Naso, Hospitality Sales Executive (S3 ’15), hosted us at the 49ers. Following a stadium tour, Demar Amacker and Paul Epstein explained the organizational structure and integral nature of CRM as strategy working hand-in-hand with sales. The Business Strategy & Analytics group, led by Moon Javaid, includes five staff members with analytics responsibilities.

S3 Senior Jacob Kurian appreciated how “every aspect of the experience at Levi’s Stadium has been thoroughly planned out.” The 49ers have created an authentic atmosphere in the stadium that reflects much of what people in the area value. Levi’s Stadium uses repurposed redwood finishing in its concourses and has 16 (Joe Montana’s number) native plant species growing on the patio atop the building. The stadium also showcases an impressive collection of local artwork.

[slideshow_deploy id=’10028′]

Next up

We completed the S3 StubHub Analytics All-Stars trip with visits with the Warriors and Giants. Stay tuned for our next report!

Spurs Share Values & Insights with Baylor Sports Sponsorship & Sales (S3)

Spurs Share Values & Insights with Baylor Sports Sponsorship & Sales (S3)
by Brad Sherrill – September 2017

What can we learn from the Spurs organization?

The Spurs were the first organization contacted before the S3 program launched in 2004. We often say that the Spurs organization is “Baylor South,” because so many of the 250+ S3 graduates started careers in San Antonio.

Nine members of Spurs Sports & Entertainment (SS&E) engaged in a series of small group panel discussions with over 100 S3 students at the September S3 Club meeting. Among these nine were Joe ClarkLaura DixonDavid ElkinsJustin Wynter and S3 alumni Stephen GrayLindsay BealeTravis GaffordAshley Johnson and  Erika Moulder.

These professionals discussed how S3 Values play out in day-to-day life in successful careers. 

Take It Personally

Justin Wynter, Manager of Corporate Partnerships for the Austin Spurs, shared a story in support of the S3 Culture tenant to always “take it personally.” Wynter spoke about how he and his associates rose from underachieving to become a top of the league organization. This hard work came to fruition when the team received 8 of 10 year-end NBA G-League awards after receiving zero only a few short years before Justin Wynter and Stephen Gray (S3 2011) decided to take personal responsibility for business performance.

Act with Integrity

Joe Clark, Vice President of Ticket Sales and Service, encouraged students to interview teams and companies. He highlighted the importance of making sure that an organizational culture is strong and a positive fit. Finding those organizations that care and do things the right way is an integral part of experiencing long-term success in the sports industry.

Go the 2nd Mile

Laura Dixon, Head of External Relations, exemplified the broad landscape of positions available across the sports industry. S3 Club members heard about her journey from working on an Olympic bid proposal to her current position where she works to strengthen stakeholder relationships on behalf of Spurs Sports & Entertainment. In going the “2nd mile,” Dixon does a little bit (or a lot) of everything in this role, going beyond the job description people typically associate with the sports industry.

Group Sales Representative Ashley Johnson shared a story of how Sales Representative Erika Moulder’s group were recently given a goal of making five in-person sales appointments for the week. Ashley noticed on the sales board that Erika set 19 appointments, going the second, third, and practically the fourth mile.

Redefine Success & Failures

S3 Club Member Tatum Lowe spoke highly of the insight she gained over the course of the evening. Lowe said she learned, “the idea of redefining our successes and failures . . . focus on the small victories that you achieve every day, before you know it these will add up to major successes.” She was inspired by how visibly passionate SS&E executives, managers and employees are about their careers, exemplified by the core principle of going the 2nd mile, in San Antonio as much as it is in Waco. In fact, they traveled 200 miles each way to freely share their time with S3 students.

How to Choose Among Job Offers

Lindsay Beale, Senior Manager of Group Sales, shared a common theme to the Spurs and S3: Pick your next position based primarily on the character and values of the manager who will directly supervise you. This person plays an integral role in developing your abilities and determining the opportunities for success. When they move up, you’ll have chances to move with them.

Next Up

Our next S3 Club outing with the Texas Rangers is on Tuesday, September 26! We will join Nick Richardson and four more S3 alumni at the Rangers, Taylor Bergstrom, Mike Segoviano, Jeff Brown and Jonah Erbe, as the Rangers take on the Astros from Globe Life Park in Arlington.

How to Sell Tickets to People Who Won’t Answer the Phone

How to Sell Tickets to People Who Won’t Answer the Phone
*This post was written by Kirk Wakefield – June 2017

Do you answer a call from an unknown number? Neither does anyone else.

Americans spend upwards of 4 hours a day on smartphones, but odds of answering an unidentified caller are about one in four. Millennials are even less likely to answer: Phone calls are seen as intrusive, impersonal, presumptive, time-consuming, and annoying.

According to Nielsen, Millennials spend more time on mobile devices than on TV. So, how do we reach them? We find them where they are and sell the way they like to buy.

Geo-Targeting: Raiders Case Study

Where people come from influences how they buy–and how much they’ll pay and when. Working with our partners at StubHub, we find out-of-town fans are willing to pay significantly more, even as game time approaches. Below we see the difference in ticket prices paid for Raiders games in 2016, which is similar to other markets with respect to time and distance. Using geo-targeting, we can target campaigns (e.g., Google AdWords; emails) based on location.


Single-game buyers and, increasingly, multiple-game buyers prefer choosing individual games (vs. ticket plans) when they want to buy and when they want to go. Young consumers have always been variety-seekers. But, Nielsen reports all buyers are increasingly focusing on a wider variety of entertainment options than in the past. Buyers aren’t just thinking about your team (i.e., the Raiders). They may just as easily click on the next Groupon, social media offer, or Yelp recommendation.

Today’s ticket buyer is twice as likely to visit ticket websites (primary & secondary sources) than to directly contact the team. Younger buyers expect frictionless[ref]Read more about frictionless service here.[/ref] experiences. That’s why teams optimize for mobile sales and distribute tickets on secondary markets to take advantage of buyers where they are and how they want to buy.

What do buyers really want?

You need to know how seats are moving in the open market to appropriately set season ticket and individual game prices to maximize revenue.

Ticket distributors (e.g., Eventellect) and sellers (e.g., StubHub) help teams understand the dynamic nature of markets by analyzing what inventory sells through and at what prices. Sample data for an NCAA property (left) illustrates a typical pattern of average ticket prices (ATP) by seating area and the percentage of those tickets which sold (STR: Sell Thru Rate).

Buyers are less price sensitive for sports & entertainment events than for pretty much anything else. [ref]Wakefield & Inman (2003), “Situational price sensitivity: The role of consumption occasion, social context and income,” Journal of Retailing, Vol 79(4), 2003, 199-212.[/ref] Here, the highest priced premium seats ($900+) and the Field Club ($250) seats sell through well (75-80%). The lower STR (67%) for Stadium Club seats suggests needed adjustments to improve perceived value compared to the more or less expensive seats nearby. The high STR on New Alumni seats suggests the team could raise those prices, but may have overshot the mark on the Gold Zone seats. Without this data, this team would continue to leave money on the table or empty seats with inefficient pricing schedules.

The right side of the charts above show the hottest seat sections on the market for this team. If they offer inventory using dynamic pricing, share revenue with a consolidator, or (opaquely) distribute via a ticket provider like StubHub, they will capitalize on the high demand for specific sections (e.g., Benchback I and Gold Zones W and CC).

When should we release inventory and adjust prices?

Most individual game tickets sell during the week prior to the event. Well over a third sell in the last 72 hours. As the sample data shows below, advance ticket buyers are willing to pay more (ATP = $128) compared to those buying in the month leading up to the event (ATP = $72).

When should tickets be released for individual purchase? Earlier is better. Some teams hold tickets back to release close to game time. But, we can see this is not the best time to get the highest price. In a forthcoming journal article, we find that experienced sports & entertainment buyers have learned it’s better to wait to buy. But, if you want to sell high–like to out-of-town visitors and other infrequent, inexperienced buyers, supply needs to increase well in advance.

Conclusion

We’ve been analyzing retail pricing strategies for over 25 years. Pricing strategies in sports are quickly catching up with corporate practices, but much less is known about pricing intangible services than pricing tangible goods and products.

If you’d like to learn more about opportunities to analyze your ticket data or gain more insights, feel free to reach out to our friends at StubHub: Charlie Rockman, Nick Rudolph, and Adam Budelli. If your organization is interested in collaborating in our research center, please contact Kirk Wakefield.


Best Ticket Campaign Ideas

Best Ticket Campaign Ideas
by Darryl Lehnus – June 2017

Kicking off the S3 StubHub Ticket Campaign Competition

Learning best practices is one of the most valuable elements of the meetings, conventions, and seminars we all attend. To that end, with partnered with StubHub to launch the annual S3 StubHub Ticket Campaign Competition at the 2017 S3 Board Meetings this past January. We’d love to have more great submissions for this year’s (January 16-17, 2018) meetings. Click here to learn more.

Finalists for the 2017 competition were Joe Schiavi, Detroit Pistons; Evans Adonis, Charlotte Hornets; Stephen Gray, Austin Spurs; and Adam Martelli and Chase Kanaly,  Houston Astros.

Shoot for your Seat

Joe Schiavi, Detroit Pistons

The Shoot for your Seat campaign was an interactive initiative to generate leads through invites from sales staff and marketing communications. Held during an off-season time frame (September), prospective clients were invited to the Palace for a fun four hours of activities. The attendees went through a series of station interactions with Piston personalities, introduction to new stadium food, a photo booth, behind the scenes staff-guided tours and the ultimate opportunity to take a shot from half court to win free season tickets. Phone follow-ups to everyone occurred within three days after the event. The results were dynamic as $100,000 in new sales were generated with an ROI of the event at 8-to-1.

Holiday Pack Mini Plans

Evans Adonis, Charlotte Hornets

The Hornets shared a “Holiday Mini-Pack” campaign that offered great flexibility and a nice Christmas present. The target audience was past holiday pack buyers and potential buyers who connected with Hornets via the email sent or linked the Hornets’ website. Leads were distributed to all sales reps with a window of November 7th thru December 30th to close the 5-game mini pack. Buyers could pick any 5 games for their packages (excluding Golden State). To motivate quick closes the first 300 buyers received a Mitchell and Ness Buzz City hoodie as a gift. The hoodie was a good gift for a friend or family member for Christmas. The campaign created an increase in holiday pack buyers averaging 30 packs a week for the duration of the campaign.

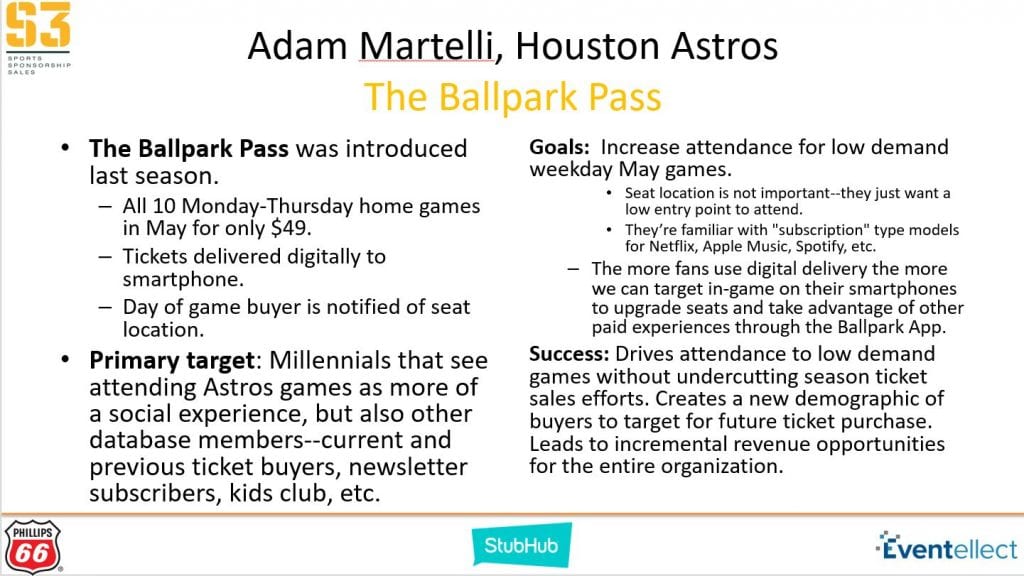
The Ballpark Pass

Adam Martelli and Chase Kanaly, Houston Astros

Some of the hardest MLB tickets to sell are the Monday-Thursday games early in the season. The Ballpark Pass focused on the 10 Monday through Thursday games in May. The primary target audience was millennials seeking a social experience. The value package of $49 includes all 10 games with tickets delivered digitally to smartphones with day of game seat assignment. The rationale behind the digital approach and seat location was that millennials place less emphasis on location and more on social experience. Sending tickets digitally is a common experience for this audience. The success of this campaign was to increase the database in this merging demographic and to increase attendance at low demand games without undercutting season ticket sales efforts. The Astros created 967 passes for almost $50K in new revenue and created an overwhelmingly positive digital experience for the target audience.

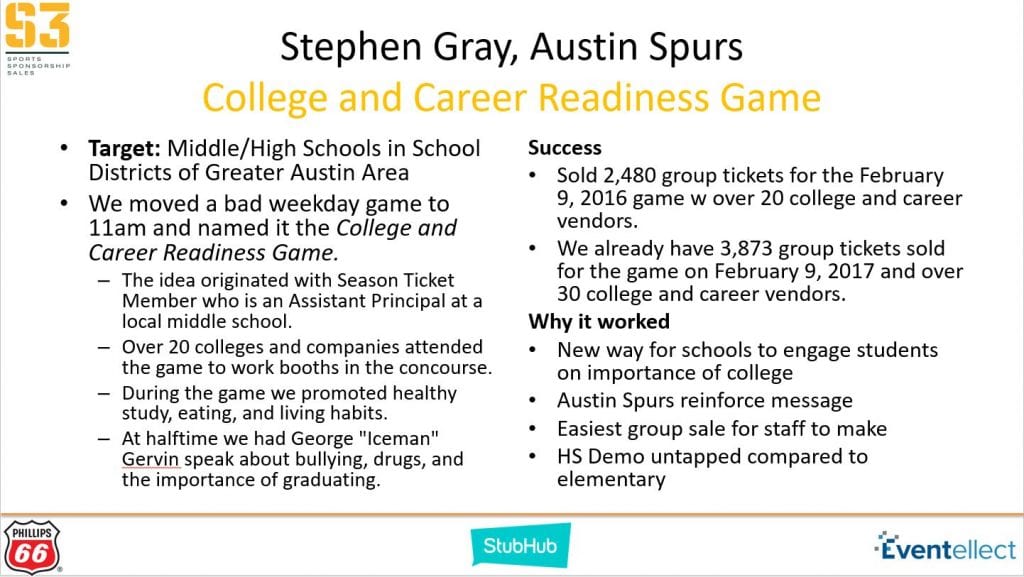
College & Career Readiness Game

Stephen Gray, Austin Spurs

The Austin Spurs took a single game approach to focus on middle and high school students. The College & Career Readiness event took a low attendance weekday game and converted it into a new revenue generator. They recruited over 40 colleges and companies to have a presence (booths) on the concourse to interact with the students. The game promotions and halftime encouraged healthy study, eating and living habits. Halftime included the Spurs iconic George “Iceman” Gervin challenging students to stay in school, lead a drug-free lifestyle, and to support anti-bullying.  The game sold 2480 group tickets in 2016 and doubled its numbers for 2017. A key to its success is the organizational buy-in at all levels with a complete focus on high school aged demographics and their educational careers.

2017 S3 StubHub Ticket Campaign Winner

Based on a vote of the 65 managers and executives attending the S3 Board Meeting Advisory meeting, the winner was Stephen Gray and the Austin Spurs “College & Career Readiness Game.”  Congratulations to the Austin Spurs and their staff for truly creating such a successful event!


Campaigns at a Glance

Below are the overview slides of each campaign. We look forward to your entry at the 2018 January 16-17 S3 Board Meeting! Click here to register.

StubHub Ticket Insights: Changes in Who, How & When People Buy

StubHub Ticket Insights: Changes in Who, How & When People Buy
by Kirk Wakefield – May 2017

In a league of its own

StubHub sells a ticket at least once every second. Over 21 million unique highly qualified buyers visit StubHub every month. Last year (2016), StubHub sold over $4.2 billion in tickets. That total essentially places StubHub in a league by itself, comparable to the NBA or Premiere League and more than the total revenues of the NHL, Bundesliga or La Liga.

Thanks to our S3 partnership with StubHub and Geoff Lester, our friends Charlie Rockman and Nick Rudolf presented breaking insights at our annual S3 Board Meeting in January, 2017.

In this article we present three of these insights related to demographics, search habits and mobile use in ticket purchase. Next month we will follow with insights on geo-targeting, conversion to ticket plan buyers, and inventory management given the timing of purchase behavior.

Demographics of online ticket buyers

Knowing half the females in the DFW metroplex are Dallas Cowboys fans, the Cowboys launched www.5pointsblue.com to offer content written by female staff members. The content appeals to the female fan base, but a broader audience as well, generating 350,000+ monthly visits. Other properties would do well to emulate the initiative to serve its entire fan base in a way that meets needs and preferences.

As seen below, we see a slight shift in females buying online (43%), but more importantly the Average Order Value (AOV) increased among first time female buyers versus first time male buyers. As millennials overtook baby boomers as the largest generation this past year, so has the percentage of younger buyers. These young buyers may see concerts and other events as viable entertainment options to sports. Commensurately, we see more lower-income first-time buyers–who will be tomorrow’s potential season ticket holders. The question is: How are teams serving the buying needs of this younger segment that will translate into future ticket buying fans?


Ticket Search: Event, Team or Date?

Knowing how people search is one of the keys to successful Google AdWords campaigns. Which of these is most likely to show up in a relevant search?

  • Event (Cavs vs. Rockets)
  • Team (e.g., Cleveland Cavaliers) or artist (Justin Timberlake)
  • Date (Friday, December 1, 2017)

We might think new buyers typically want to see a specific event on a certain date. We would be wrong. Instead, buyers increasingly and foremost search for the team or artist, rather than having a specific event or date in mind. Furthermore, last minute purchases (33%) and on-the-go (not at home/office) are the major reasons for purchasing via mobile. So, if we want to reach people where they are–with phones in hand–we best be mobile and search-engine optimized for quick access.


Mobile First Strategy

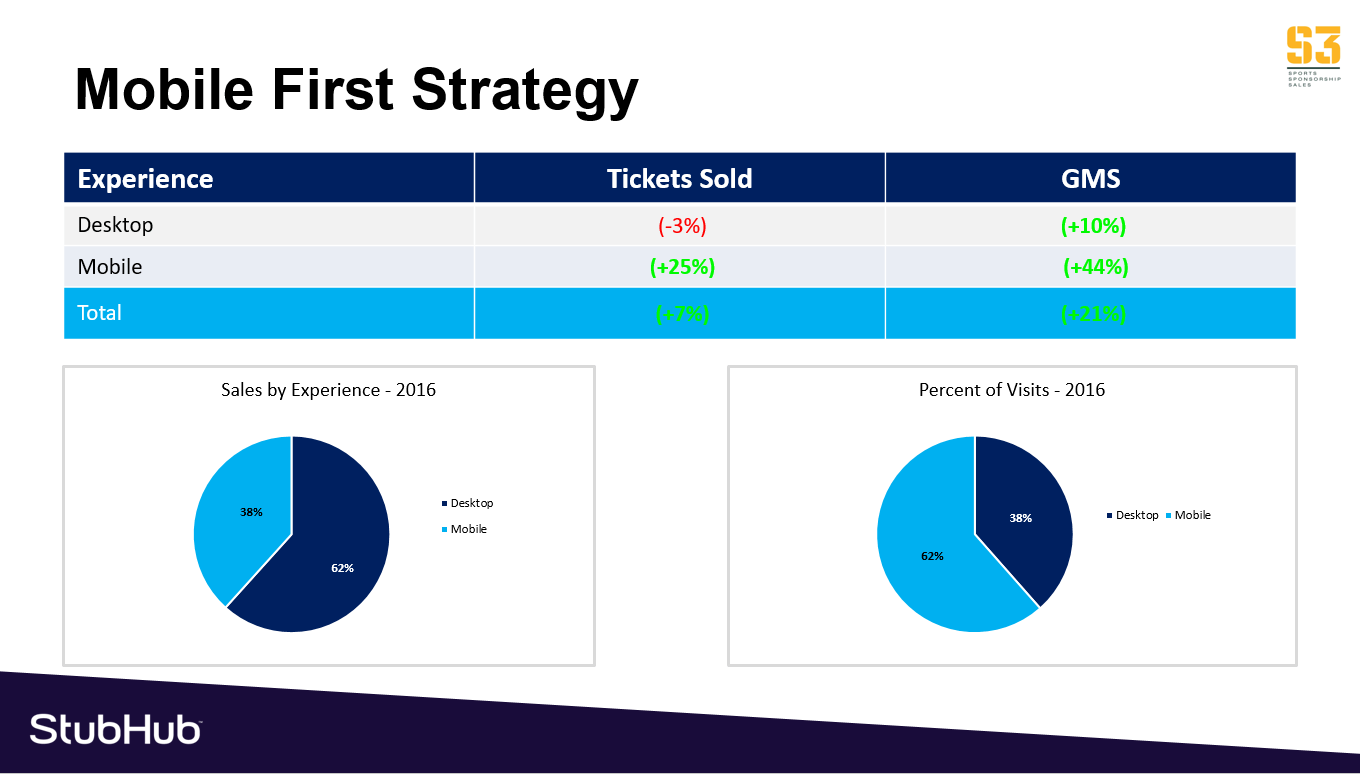
In 2014, 41% of traffic and 20% of sales came via mobile for StubHub. Just two years later, 60% of traffic and 42% of sales came via mobile. In general, revenue from 2015 to 2016 is increasing via online purchases, but disproportionately via mobile in terms of tickets sold (+25%) and total sales (+44%) compared to tickets sold via desktop (-3%) and total sales (+10%). (See graphic at the top of this article.)

Expect the trend toward mobile to continue. In the past the majority of time spent on mobile was searching, but most purchases of goods and services were made on desktops. But, as StubHub and others with native apps improve the mobile experience, more will shift to mobile purchases.  As seen below, the majority of purchases are still on desktops, but more bought via mobile devices and native apps in 2016 than 2015. The most mobile-friendly buyers are football (NCAA & NFL) fans, but the growth in mobile purchases will extend across leagues.


Conclusion

In short, the takeaway insights are:

  1. Target females the way they consume content and make purchases.
  2. Manage search engine campaigns aimed at team/artist searches, more so than event or date.
  3. Optimize for mobile ticket purchases. If your mobile sales are not growing at the same rate as the market, you are not mobile optimized.

When do people buy? And what happens to average ticket price over time? We know over one-third now wait until the last 72 hours to purchase. To learn more, come back for next month’s release.

An Internship Model for Sports Sales, Marketing, CRM & Analytics

An Internship Model for Sports Sales, Marketing, CRM & Analytics
by Kirk Wakefield – January 2017

After arranging & supervising hundreds of sports internships for the last dozen or so years, Dr. Darryl Lehnus and I devised a system that works well for us.

Ideally, partners provide the internship with the same objective of developing and evaluating talent in view of future employment there or elsewhere. Our partners see intern successes as their successes, as it reflects on their abilities to train, motivate, and model excellent performance.

Among others, the Pittsburgh Pirates B.U.C.S Academy and the New York Mets are ahead of the game in organizing internships and recruiting to careers. While many teams and companies provide summer internships, the Houston Texans (sponsorships) and Houston Astros (CRM) provide 9-12 month postgraduate internships specifically for our graduates to gain more in-depth training before launching careers.

Our best-in-class partnerships do five things:

  1. Budget for internships.
  2. Show up every year to interview.
  3. Provide awards or incentives. (Examples: See StubHub & MLBAM.)
  4. Serve as mentors.
  5. Initiate follow-up with interviews to (a) hire or (b) refer for hiring.

Five Not-So-Easy Steps

From a process standpoint, partners follow these five steps. We’ll explain each in turn.

  1. Prepare students for careers.
  2. Determine parameters & responsibilities.
  3. Define, communicate and evaluate on criteria that predict success.
  4. Hold students responsible.
  5. Review insights & follow-through with students.

Prepare students for careers

Ask employers what they want. Continue to ask.

Too many prepare students for sports marketing or sports management jobs. The only problem is no entry level positions exist for “sports marketer” or “sports manager.” Entry level positions do exist in ticket sales, sponsorship sales & service/fulfillment, CRM, and analytics. Design coursework and programs accordingly.

Business schools have courses in professional selling, database management, statistics and predictive modeling, and data visualization (Excel, Tableau, etc.). Take advantage of these courses in planning curriculum requirements. When employers see you take them seriously, they’ll line up for your students.

Determine Parameters & Responsibilities

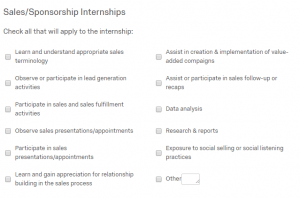
Once employers agree, we send them a link to an online form to identify the supervisor, time frame (start, finish, hours per week, pay or course credit), and responsibilities. Most likely you’ve already discussed this, but best to not be surprised at the end of the term that the internship didn’t include a vital part of what they needed to experience.

After selecting the type of internship, the employer completes the appropriate section for what the intern will do. Our forms are below.

Define, communicate and evaluate criteria for success

Every year the National Association of Colleges & Employers (NACE) publish a list of attributes most desired of new hires. These could differ among some, but odds are they are the same. With a little adaptation, we use these for midterm and final evaluations by the intern’s direct supervisor.

Responses on the primary criteria (below) are shared with the intern in a meeting with the academic advisor. We also ask about punctuality, attitude, performance, and overall grade from the direct supervisor of the internship at the employer. The entire form may be downloaded here.

Sports Internship Evaluation Criteria

Specific to our own preparation and values, we ask students to be 2nd milers. When asked to do something (walk a mile), go above and beyond expectations (go the second mile). Supervisors rate the intern accordingly (below).

Hold students responsible

Students should perform well in the internship. We expect that.

We also expect them to reflect on what they learn. Keeping a daily or weekly journal is recommended.At the end of the term, students must submit the S3 Internship Report Form (click to download) regarding a weekly log of hours, assignments, volunteering, accomplishments, application of class material, issues (problems or challenges & resolutions), culture, behavioral adaptation, recommendations, and net promoter score rating for the internship.

Review insights & follow-through with students

Meet with each student to get his or her take on the evaluation provided in Step 3. Usually there are no surprises. Employers do a good job of picking up on areas for improvement that you’ve likely noticed in class. So, it’s nice to have someone else see it and say it.

Generally, these are great times to encourage students in careers. On occasion, you can use these to give appropriate kicks in the pants. We’ve seen these have fairly drastic effects on capable students who needed to get with the program. On occasion, you find some who need to find another program. The wide world of sports, perhaps the same as other industries (but we think more so),demands a high level of commitment. We help students by holding them to a high standard.

Conclusion

Providing good internship experiences takes effort on the part of the academic advisor, student, and employer. But, working together, internships are the foundation for successful careers. No class, book or assignment can substitute for on-the-job reality training.

The very best part of what we do is to see students succeed in their careers.

Feel free to borrow, steal, or adapt any or all of the attached materials! If you’ve found other things that work well, please let us know!

4 Keys to Effective Ticket Pricing

4 Keys to Effective Ticket Pricing
by Kirk Wakefield – November 2016

Leave Emotion at the Door

In a scene from the movie Ocean’s Eleven, Rusty (Brad Pitt) is teaching Hollywood actors how to play poker. During his lesson on “how to draw out the bluff,” he asks a player what the first lesson of poker is. The answer: “Leave emotion at the door!”

Does that lesson sound familiar?

One of the greatest mistakes a sports organization can make is pricing from a sense of pride–Charging what we want or need instead of setting our prices based on fan and market intelligence.

Considering these four key questions will help make good pricing decisions.

Are we pricing to move inventory or leverage revenue?

Ticket pricing isn’t only about numbers. It’s a strategic puzzle. The answer to this question provides you strategic direction and synergy for the season, games, packages, sections and seats. Pricing synergy maximizes value, retention and new sales.

What does the fan & market intelligence tell us?

Decisions based on your intuition and experience alone is basing your plans more on the past than present circumstances. Include in your decision making:

  1. sales reports & forecasts
  2. current industry trends
  3. fan surveys
  4. social media conversations (consider scraping and social listening software)
  5. gatekeeper feedback (ticket office, ticket sales, development staffs)
  6. direct conversations with fans

What is the unique value of each game?

Whether you’re using advance pricing software or a traditional method of pen and paper, recognize each game has unique value. Variable pricing (different price levels for differently valued games) and dynamic pricing maximizes value, revenue and sales. Analyzing what makes each game different from the others helps you set realistic price and attendance targets and also identify segments and groups to target.

What is our inventory analysis telling us?

Using past data and forecasts, ask these 7 inventory questions to maximize revenue for each game.

  1. Which sections do we need to sell each game?
  2. How many seats do we need to sell each game?
  3. Which groups are we targeting for each game?
  4. Which promotions are we scheduling for each game?
  5. What is our plan for distressed inventory should advance sales fall short?
  6. How do game day variables (time, date, opponent, fan experience, etc.) affect each game?
  7. Did we objectively project sales for each group or promotion?

Have these conversations a year in advance to capitalize on year-round sales opportunities and for a runway that is long enough for your external relations team to realize success!

“Pride goes before destruction, a haughty spirit before a fall.”
Proverbs 16:18