The students POV on interviews for internships & careers

The students POV on interviews for internships & careers

After the first round of the Baylor S3 Pro Day of virtual recruiting with 30 interviewers, 54 of the students rated each of the interviewers, selected their favorite two interviewers, and commented on one that didn’t go as well as hoped. After the second round of S3 Pro Days on March 5 (click here for more info), we will distribute information to interviewers (who also get the chance to rate the students on their interviewing skills). The S3 Best Interviewer Awards for S3 Sales and S3 Analytics will be announced for the S3 Awards Banquet on April 14.

These evaluations are much like teaching evaluations. We certainly prefer students enjoy the experience. Admittedly, sometimes learning experiences can cause user discomfort. So, good on you as professor or recruiter if you can do both: Supply enjoyable learning experiences that serve the welfare of all parties for both the short and long term. To that end, we offer 45 comments about what students liked best about interviewers, which thankfully outweigh the 24 comments on areas of improvement. Learn as you will from these.


Student POV

Interviews for Sports Sales & Analytics Internships & Careers


45 Areas of Excellence

1.       Intentionally listened and asked good questions.
2.       Asked very thoughtful questions and really answered my questions well.
3.       Most enthusiastic and didn’t make it feel like there was a power difference between him and me.
4.       Most willing to show me things like what they do in Tableau.
5.       Just fun to talk to.
6.       Really easy going and easy to talk to.
7.       They stood out above the rest for their openness while discussing their roles and the company culture at their respective teams. They came across as completely genuine, giving me their unfiltered opinions on their workplace instead of telling me any kind of pitch.
8.       Made me feel instantly comfortable during both conversations I had.
9.       Super genuine and friendly; They were not intimidating at all and very helpful in explaining their role and answering my questions.
10.   Very easy to talk to and did a great job answering any questions I had. I very much enjoyed talking and felt at ease and was disappointed when our time was up.
11.   Asked unique and challenging questions that kept me on my toes.
12.   Was genuine and kind while also getting down to business without any unnecessary conversation.
13.   Very personable and made a hectic time feel relaxed, calm and helpful. Made the conversation feel mutually beneficial which was great. Super informative and helpful.
14.   We had a really great conversation about just life. We shared a lot of similarities; was informational, and I got to walk through my resume.
15.   Took an interest in me beyond my job qualifications and wanted to get to know me better on a personal level. They made me feel like they wanted to speak with me and told me I could reach out any time in the future.
16.   Asked great questions and directed good conversation! Awesome at engaging and made me feel really comfortable.
17.   I was able to see how well they enjoyed not only working in their field but with each other too.  I also felt relaxed in the interview and it was one of the ones that I actually had fun being interviewed.
18.   They were the two most enthusiastic people I talked to.  I made really good connections with both of them. They also were very interested in making it clear that if I were hired that they would invest in my career to the fullest extent.
19.   Was very specific and had the 30 min interview laid out in sections of what to accomplish. I got to do a mock phone sale and a 45sec pitch.
20.   Genuine and engaging during our talk.
21.   Very open to answer any and all questions and truly share passion for the job and role as a manger. Provided an open and transparent look at goals for those new to the organization and what managers seek to get out of them.
22.   They made the conversations really smooth and easy and showed a genuine interest in me.
23.   Was very open and had great energy. Seemed very invested in our interview and even joked around a little bit. Overall a great interview and I was incredibly impressed with the organization.
24.   They gave great insights on what their companies did and gave in-depth analysis of the field of analytics, especially CRM and BI. Also, they made the effort to personally connect with me.
25.   Asked challenging questions and, in the interview, pushed me to do better. Charismatic and has good leadership.
26.   It felt like they were actually interested in getting to know me.
27.   They had amazing humor and personality and seemed really interested in talking to me! They acknowledge all of what I said and asked follow-up questions accordingly. They made the speed dating a lot of fun because it may have been an interview, but it seemed more like catching up with an old friend!
28.   Seemed very interested throughout our entire call and even asked for a second interview to better our connection in order to be a future reference for myself.
29.   Discussed the many ways they took care of employees during the ongoing pandemic, both with their mental health and with their paychecks. Detailed how the team handles the social issues that have become as prevalent as ever in recent times.
30.   Open, friendly, and honest. Made me feel more comfortable.
31.   Extremely genuine and excited to hear about why I want to get into sports. They asked very good questions and went into detail when answering questions that I asked about their organizations. Both came across as wanting to help me in my journey in any way they could.
32.   Very interested in me and my future goals, very engaging.
33.   Super high energy and gave me an awesome description of time with the team. Super helpful and seemed genuinely interested in my career growth.
34.   Asked questions about my personality and we were able to chat and have a great conversation!
35.   Gave me a whole lot of advice on how I could answer interview questions better. Offered to connect me with other people within the organization, which was awesome.
36.   Truly took the time to know me and understand what I was looking for in a future job opportunity.
37.   Very encouraging.
38.   Let us know that no matter what happens they were here to help us. Even if that means we go for a decision and it does not include their organization. That is admirable.
39.   Took the time to know me knowing that I am only a sophomore yet was intrigued when looking at my LinkedIn profile. So kind and just wanting to help.
40.   Extremely kind, was prepared with knowledge about me, insightful answers to my questions, willing to help, relatable.
41.   Very interested in what I had to say and gave me great advice.
42.   Very kind and helpful.
43.   Gave great advice, flowing conversation, tremendous insight into job and analytics in sports. Willing to help.
44.   Seemed very genuine in wanting to get to know us. Gave me some valuable advice and perspective.
45.   We had a fantastic conversation about the importance of mental health in the workplace (and in general) and the emphasis put on it.

24 Areas of Improvement

1.       Really didn’t have much of an interview experience. It was too casual.
2.       Questions were very vanilla. Couldn’t get a good read off them.
3.       Didn’t really seem like they wanted to be there.
4.       Wasn’t easy to talk to.
5.       I sort of felt like I had to lead the conversation, where with the other recruiters, they were the ones guiding it.
6.       Seemed not to take our 10-minute call seriously. Never made eye contact and was constantly looking around the room. Gave cookie-cutter monologue and nothing more.
7.       Asked very structured concrete questions. I heard from others that they kept people over time and shorted others. Didn’t appear open.
8.       Informational but it was very cold. It wasn’t a natural conversation like the rest of my 10 min talks.
9.       Rapid fire questions, less conversational interview (granted, we only had 10 minutes).
10.   Asked a lot of questions that didn’t pertain to anything important and also not related to S3 or internships.
11.   Did not feel a connection with the organization or interviewer specifically.  Nothing against, is a great person.  I just did not find myself enjoying the interview or the chemistry.
12.   A stand-in for my interview didn’t seem too ecstatic to be there. Seemed very dry.
13.   Not very engaging and didn’t show a lot of emotion.
14.   Had one short interview where I was asked very off-topic and slightly offensive questions.
15.   I was confused on the style of the interview. Seemed harsh.
16.   Seemed very distracted; like the focus was elsewhere from the start. It threw me off a little bit and it felt like we never really got into the interview at all.
17.   Didn’t have a lot of emotion and didn’t seem that interested in talking to me. It felt like more they were just doing this to put a check mark on their calendar.
18.   Felt more like an actual interview and less of a conversation. It was intense, which is fine, but I enjoyed some other conversations more since they were more chilled.
19.   Conversation was not engaging and was not very interested in me or what I was saying.
20.   Didn’t really seem very interested in being at the event. Wasn’t super open about time with organization, which made the interview pretty difficult to stay engaged with.
21.   Not all that open to talking much about the organization and the conversation was hard to get through.
22.   Impersonal and mechanical conversation. Improved in the second round of interviews but felt like they were checking boxes rather than trying to make a connection or be a resource.
23.   Typing the entire time.
24.   It was so awkward; I was given short answers to questions that I asked.

Baylor S3 Welcomes New Director | Kicks-off S3 Zoom Class Reunions

Baylor S3 welcomes Lane Wakefield as new S3 Director

Welcome to the new S3 Director


S3 Alumni + Business Professionals: Would you like to be involved in S3 this coming school year? Dr. Lane Wakefield invites you to let us know how! Click here.


With co-founder of the S3 program, Dr. Darryl Lehnus, retiring close of Fall 2020, Baylor University’s Hankamer School of Business is bringing in Dr. Lane Wakefield (Baylor MS ’11) as the incoming Director of the Center for Sports Strategy and Sales (S3). Lane followed in his father, Dr. Kirk Wakefield’s footsteps to create a program patterned after S3 at Mercer University after completing his PhD at Texas A&M in 2016. After a national search, Lane was selected as the incoming S3 Director.

At Mercer University (Macon, GA), Lane helped build their Sports Marketing & Analytics program and launched the National Collegiate Sports Sales Championship. He has published research in prestigious marketing journals, including the Journal of Service Research and Journal of Interactive Marketing, as well as upcoming articles in the Journal of Advertising and Journal of Advertising Research. At Mercer, Lane worked closely with the professional sports teams in Atlanta and throughout the Southeast, as well as with companies and agencies, to educate, train and place students.

With two Dr. W’s in the Center for Sports Strategy & Sales in the Marketing Department, Kirk will continue as the Executive Director, while Lane is the Program Director. As Marketing Department faculty members, both report to the Department Chair, Dr. Chris Pullig, and together will continue the innovative efforts initiated by Dr. Lehnus and the senior Dr. Wakefield.  As Lane noted,

“We have always worked well together. Not only through childhood, but even the last few years on research papers. The potential synergy is exciting. It usually takes years to get to know your colleagues, to develop trust and an understanding of each other’s strengths and weaknesses—we’ve got that in spades,” Lane said.

Lane added how it will be an honor to follow the leadership modeled by Dr. Lehnus,

“There should be another version of ESPN’s 30 for 30 documentary ‘Doc and Darryl’ to share what Baylor S3’s Dr.’s Kirk and Darryl accomplished. Most everyone in the sports business world knows and respects S3. A key reason is the Center’s mission to instill integrity. Darryl shared with me how central integrity is to his S3 courses and relationship-building with students. It’s an honor to have the opportunity to build on what he’s done through the Values-Based Leadership course and how the two together established integrity as a hallmark of the program.”

S3 Zoom Class Reunions with Dr. Lehnus

As Professor Lehnus enters his final semester at Baylor this fall, we schedule S3 Class Reunions on Zoom to chat with Dr. Lehnus, each other, and we’ll save a little time to meet the old and new Dr. W’s.

Each meeting will start at 5pm, Thursdays, as follows, with designated class captains helping us get everyone Zoomed in. Click here to register. You’ll need the Eventbrite (free) ticket to access.

  • September 10 | Classes 2006-2007 | Todd Pollock + Brian George
  • September 17 | Classes 2008-2009 | Mike Vogelaar + Lauren Ward
  • September 24 | Classes 2010-2011  | Chase Jolesch + Evin Martinez
  • October 1 | Classes 2012-2013 | Michael Hurley + Sarah Proctor
  • October 8 | Classes 2014-2015 | Austin Avery + Blake Pallansch
  • October 15 | Classes 2016-2017 | Julio Pineda +  Erica Moulder
  • October 22 | Classes 2018-2019 | Ali Harman + Tanner Clark

Other previous or current advisors and friends in the professional ranks are invited to join any of the class meetings.


The Sports Strategy & Sales (S3) Program Expands!

The Sports Strategy & Sales (S3) Program Expands!
S3 in LA circa 2009

When the S3 program launched in 2004 we were—and are—the only academic program in a business school devoted to developing talent aimed specifically at generating revenue in the business of sports. After placing more than 270 professionals in sales and analytics positions we see even greater demand for Baylor S3 graduates. Notable S3 alumni in management and executive positions at scores of professional teams, corporations, and agencies now mentor, train, hire, and advise students right alongside us, as do many outstanding professionals from coast-to-coast.

As we look forward to the next 15 years we must set the stage for success for those who follow. Much has changed in the past 15 years. Think about it. After the first graduating class of S3 majors in 2006, the iPhone was introduced in 2007. This mobile revolution transformed how fans search, buy and go to the game. Augmented and virtual reality are changing how fans engage with our experiences and sponsors. Venues are beginning to use facial recognition as admission.

With the onslaught of data and digital selling, properties and brands recruit and pay for the talent to manage and analyze data to more effectively and efficiently reach fans where they are—which is mostly (online) on their phones, tablets or desktops. The most productive organizations invest heavily in technology capabilities (in-house and/or outsourced) to enable the salesforce to connect and engage with fans in ways we couldn’t even imagine even 10 years ago.

Our position has always been at the forefront leading the way into the future. In keeping with our WINS values, we need more hard-working, integrated, relationship-driven, spirited people to join us.

Missing Talent

The advantage and disadvantage of the S3 major in the Hankamer School of Business has been its exclusivity. The most successful students consciously committed to a career in the business of sports no matter what the costs. That is still the case. As a side note—conscientious commitment to excelling in your craft, to your career, is still the price to be paid for success no matter the business. Companies still buy from people who know where they are going.

At the same time, S3 missed potential sales superstars. Great salespeople love to keep options open. Not wanting to be constrained to sports, they didn’t take the chance to be sold themselves. The Vice President of Sales at the San Antonio Spurs, along with many executives at other teams, often say, “Hey, just let me have a chance to talk to them!”

S3 missed out on problem-solvers keen to manage and analyze data to answer big questions businesses have in a digital-first marketing world. Marketing majors with a double-major with MIS, Accounting or Finance took their talents elsewhere. The Wide World of Sports has been slow to get up to speed. But, like every company today, they now demand more highly skilled analytically-minded graduates to close the gap.

Opening the Doors

S3 majors have always been well-rounded. Salespeople understand analytics and analysts understand sales. All understand the importance of living lives of integrity. Having integrity means having the courage to face the demands of reality. The reality is sales-oriented students thrive in the sales courses. Analytic types want the freedom to build out technical and quantitative skills.

Recognizing these realities, and the realities of marketplace demands and opportunities, the S3 program has moved to open courses to all Marketing majors. Students may choose an emphasis in S3 Sales (MKT 3310 and 4341) or S3 Analytics (MKT 4342 and 4360), plus an internship, for a total of 9 hours. They can still take all S3 courses (15 hours) if they use additional upper-level business electives. All S3 students selecting one of the two areas of emphasis will complete an internship in sales or analytics in the summer after the junior year. Read more here.

Internships

Our stock & trade has always been internships at the highest levels of professional sports, as well as associated brands and agencies. As Colin Faulkner, Senior Vice President of the Chicago Cubs, famously said in our first S3 promotional video, “In sports, to get a job you need experience. But to get experience you need a job.” Internships provide the job that provides the experience that gets you started in your career in sports.

We will continue placing students in internships for those that declare an S3 emphasis and take the sales or the analytics courses in succession during the junior year. Others may take the courses and interview for internships and positions as available, with priority going to declared S3 program students.

Graduates in the 2021 class and beyond may submit their declarations as S3 program members by completing this form.

The S3 Club

S3 Mentors

Further priority for internships and positions is given to those active in the S3 Club. The S3 Club will continue under S3 faculty advisement but will be wholly and completely run by students, supported by an S3 Alumni Advisory Group. The objectives of the club will continue to be to network with sports business executives and to learn more about relevant careers.

The End Goal

With the end in mind, our vision continues to be to instill integrity in the business of sports & entertainment. What’s changed? Nothing, except we want more students to catch the vision, to consider the opportunities, and to join us! We’ve removed every obstacle to keep superstars from exploring business careers in sports. Want to talk some more?

Interested in sports sales? Contact Darryl_Lehnus@Baylor.edu

Interested in sports marketing analytics? Contact Kirk_Wakefield@baylor.edu

Do MLB giveaways and special events influence attendance?

Do MLB giveaways and special events influence attendance?
by Kirk Wakefield – October 2018

Forbes reported before the 2018 season started that clubs planned over 1800 special event promotions, including about 28 giveaways per team on average. The Cardinals (49), Dodgers (42), and Cubs (41) all topped 40 giveaways. The Marlins (11), Athletics (14), and Diamondbacks (15) were the least giving. If you’re already seeing a pattern, you may be onto something.

Not everyone follows MLB attendance with the same passion as I do. I’ve been tracking and analyzing MLB attendance trends decade by decade since 1990. In the 1990s and early 2000s, it was the rash of new stadiums drawing fans to the game. As we move into the current decade, the strongest predictor of attendance is the presence of star players (represented by total payroll) and the fact that each new year brings overall lower attendance. Winning has always been important, but always behind star power and stadium-related factors (including capacity). Ticket prices, as we’ll see shortly, rarely influence annual attendance. Instead, we can reliably predict next year’s prices based on this year’s attendance.

What about giveaways and special events?

We don’t have historical, annual data on the number of giveaways and special events offered by team. But, thanks to Forbes, we have them for 2018.

It’s not enough to ask, “Are more giveaways and special events correlated with attendance?” You must account for anything else that might influence attendance. Thankfully we did this for you.

To explain average attendance (right) we include the following factors for each team:

  1. Total payroll in dollars
  2. Won/loss percentage
  3. Stadium capacity
  4. Special Events
  5. Giveaways
  6. Population/Franchise Index 1
  • Fan Cost Index (see Team Marketing)
  • Park factors: Runs scored; Home runs


The results

We can explain 91.3% of the variance in attendance with these factors. If you think that is high, you are correct. We rarely explain over 90% of anything. If you’d like to play with the data yourself, click here to download. 2

We numbered the factors above for a reason. They represent, in order, those factors with the most influence on attendance. Total payroll (B = .411), winning (B = .328), and size of the stadium (B = .313; i.e., bigger stadiums like the Yankees and Dodgers) each strongly predict average attendance.

Special events (B = .224) and giveaways (B = .198) significantly influence attendance (p < .05). But, not so fast. We took a deeper dive on the relationship of giveaways on attendance. The relationship is not linear.


As most readers likely guessed, what we see is the classic sideways-S curve of a cubic function. Ok, maybe you don’t hit these kinds of curves very well. But, you can see from the graph that teams offering few giveaways (e.g., Marlins and A’s) fared poorly.  As teams offer 10-20 giveaways, attendance increases. However, the dip in the curve shows a good many teams with 20-40 giveaways actually decrease in attendance. This is bad.

What is good? Going all out. The teams offering 40 or more fared very well. This finding is consistent with the philosophy of making the big even bigger. Rather than using promotions only to shore up lousy games, make the big game weekends too big to ignore. The spillover excitement offers a windfall to attendance overall.

What is better? More giveaways and special events give fans more reasons to go. Without, you’re just selling baseball. With, you’re selling entertainment. Want baseball fans to bring less motivated family members and friends? Give them a reason. Many reasons.

The unconvinced are saying, well, those are the Dodgers, Cubs and Cardinals. They have bigger or better stadiums, or winning teams, or maybe bigger markets. We accounted for all of that, remember? These numbers don’t lie. The number of giveaways explain or predict attendance (apart from everything else), and the effect increases at an increasing rate.

Conclusion

The results also show that special events significantly increase attendance. Teams like the Padres (172), Brewers (136), and Royals (126) benefitted from these appeals to different market segments to increase attendance above what it would have been without them. We can argue those with the fewest special events (Red Sox, Mets & Yankees) didn’t need them because of the other factors going in their favor. What might they have done with them?

Finally, it’s always interesting to note the cost of going to the game doesn’t influence average attendance. Neither did any of the park factors, like runs scored or home runs. The total market size and inter-city rivalries help attendance, but just as it has from 1990-2015, it is the least (although significant) effect.


  1. The PFI accounts for larger markets + total major league franchises in the DMA. The New York teams lead the way with the largest population and the most (9) major league teams.
  2. To get 91.3% R-Squared you need to include the quadratic and cubic functions for giveaways.

Are Silicon Valley Teams as Data-Driven as You’d Expect?

Are Silicon Valley Teams as Data-Driven as You’d Expect?
by Brad Sherrill – October 2017

With Apple’s headquarters right down the street, you would expect the teams in Silicon Valley to be digitally-savvy and data-driven. We were not disappointed, as the teams from San Jose demonstrated how they employ business intelligence to generate revenue.

Sharks Leadership Analytics-Driven

Flavil Hampsten, Executive Vice President & Chief Marketing Officer, began honing his sales & marketing analytic skills to drive revenue while completing his MBA at Arizona State in 2009 and serving as Vice President of Ticket Sales at the Phoenix Coyotes, before heading to the Charlotte Hornets and now back in the NHL at the Sharks. Neda Tabatabaie was brought in at the Sharks to implement a cohesive data strategy when Mr. Hampsten arrived in 2015.

CRM Boosts Sales

S3 graduate McKenzie Bryan said, “I really enjoyed hearing from the Sharks on how well they integrate CRM/Analytics into the sales department and all of the ways a solid CRM system helps sales.” The Sharks organization encourages utilization of CRM to achieve more efficient and effective sales numbers. Beyond this, however, the Sharks want salespeople to be analytical and intentional as they attempt to make connections with current and future fans.

[slideshow_deploy id=’10035′]

49ers Commit Headcount to Analytics

Hayley Di Naso, Hospitality Sales Executive (S3 ’15), hosted us at the 49ers. Following a stadium tour, Demar Amacker and Paul Epstein explained the organizational structure and integral nature of CRM as strategy working hand-in-hand with sales. The Business Strategy & Analytics group, led by Moon Javaid, includes five staff members with analytics responsibilities.

S3 Senior Jacob Kurian appreciated how “every aspect of the experience at Levi’s Stadium has been thoroughly planned out.” The 49ers have created an authentic atmosphere in the stadium that reflects much of what people in the area value. Levi’s Stadium uses repurposed redwood finishing in its concourses and has 16 (Joe Montana’s number) native plant species growing on the patio atop the building. The stadium also showcases an impressive collection of local artwork.

[slideshow_deploy id=’10028′]

Next up

We completed the S3 StubHub Analytics All-Stars trip with visits with the Warriors and Giants. Stay tuned for our next report!

How far will analytics take You? S3 majors meet with partners at StubHub, Giants, 49ers, Sharks, & Warriors to Find Out

How far will analytics take You? S3 majors meet with partners at StubHub, Giants, 49ers, Sharks, & Warriors to Find Out
by Brad Sherrill – September 2017

StubHub and Baylor S3

StubHub and Baylor S3 created a partnership to reward motivated, analytically-talented S3 students with an expenses paid trip to the Bay area. The inaugural S3 StubHub Analytics All-Stars group visited San Francisco for three days, gaining valuable interaction time with representatives from some of the Bay’s sports industry leaders. Thanks to StubHub’s generosity, we spent three days visiting with executives from StubHub, Golden State WarriorsSan Francisco 49ersSan Jose Sharks, and San Francisco Giants.

S3 Senior Ian Young said, “It was great to see the variety of career paths people have taken to get to where they are in the sports industry. I really got a feel of how closely connected people are in the sports industry and how best practices are shared among teams.” Young also commented on the value of being data-driven as an organization. Each organization relies on a data strategy to generate revenue utilizing analytics, CRM, and BI/BA to derive actionable insights.

[slideshow_deploy id=’9986′]

The StubHub Data-Driven Culture

Our group began the circuit of Bay area sports and entertainment properties by visiting StubHub’s corporate offices. Located in downtown San Francisco, the office encapsulates much of the Silicon Valley atmosphere and emphasis on creating a comfortable, enjoyable work environment.

S3 students received a tour of the office followed by interactive panel discussions with six StubHub employees whose positions touched many of the company’s various focuses. S3 Senior Jonathan Roselli found value in “understanding how analytics are used to report, optimize and predict performance.”

Adam Budelli headed the panels that included Charlie RockmanRaymond DelacruzMena AlsrogyRyan McDowell, and Adam Tatum. These professionals work in areas covering partnerships, business development, data management, analytics, consumer insights, data science, business operations, and marketplace supply chain analysis.

Join us!

If you are interested in the Sports Sponsorship & Sales (S3) program at Baylor, visit www.baylor.edu/business/s3. Prospective students and transfers can find out more about their tickets to a career in sports. Like StubHub and other S3 Leadership partners, organizations can learn about supporting the growth of talent for the industry by visiting www.baylor.edu/business/s3/board.  Look for more stories with insights from executives we met at the Warriors, 49ers, Sharks, and Giants in the coming weeks.

Since launching the first Sports CRM & Analytics track in the U.S in 2011, the S3 program is the leader in placing graduates in data analytics roles at teams [Dallas Cowboys, Dallas Mavericks, Dallas Stars, Houston Astros, Houston Dynamo, Houston Texans, San Antonio Spurs, Madison Square Garden, New York Yankees, Denver Nuggets, Columbus Blue Jackets, Orlando Magic, Miami Dolphins, , Utah Jazz, University of Southern California] and sports-related companies [KORE Software, Stone Timber River, Eventellect, E-15 Group, The Company, Legends Hospitality, and SportsDesk Media]. 

An Internship Model for Sports Sales, Marketing, CRM & Analytics

An Internship Model for Sports Sales, Marketing, CRM & Analytics
by Kirk Wakefield – January 2017

After arranging & supervising hundreds of sports internships for the last dozen or so years, Dr. Darryl Lehnus and I devised a system that works well for us.

Ideally, partners provide the internship with the same objective of developing and evaluating talent in view of future employment there or elsewhere. Our partners see intern successes as their successes, as it reflects on their abilities to train, motivate, and model excellent performance.

Among others, the Pittsburgh Pirates B.U.C.S Academy and the New York Mets are ahead of the game in organizing internships and recruiting to careers. While many teams and companies provide summer internships, the Houston Texans (sponsorships) and Houston Astros (CRM) provide 9-12 month postgraduate internships specifically for our graduates to gain more in-depth training before launching careers.

Our best-in-class partnerships do five things:

  1. Budget for internships.
  2. Show up every year to interview.
  3. Provide awards or incentives. (Examples: See StubHub & MLBAM.)
  4. Serve as mentors.
  5. Initiate follow-up with interviews to (a) hire or (b) refer for hiring.

Five Not-So-Easy Steps

From a process standpoint, partners follow these five steps. We’ll explain each in turn.

  1. Prepare students for careers.
  2. Determine parameters & responsibilities.
  3. Define, communicate and evaluate on criteria that predict success.
  4. Hold students responsible.
  5. Review insights & follow-through with students.

Prepare students for careers

Ask employers what they want. Continue to ask.

Too many prepare students for sports marketing or sports management jobs. The only problem is no entry level positions exist for “sports marketer” or “sports manager.” Entry level positions do exist in ticket sales, sponsorship sales & service/fulfillment, CRM, and analytics. Design coursework and programs accordingly.

Business schools have courses in professional selling, database management, statistics and predictive modeling, and data visualization (Excel, Tableau, etc.). Take advantage of these courses in planning curriculum requirements. When employers see you take them seriously, they’ll line up for your students.

Determine Parameters & Responsibilities

Once employers agree, we send them a link to an online form to identify the supervisor, time frame (start, finish, hours per week, pay or course credit), and responsibilities. Most likely you’ve already discussed this, but best to not be surprised at the end of the term that the internship didn’t include a vital part of what they needed to experience.

After selecting the type of internship, the employer completes the appropriate section for what the intern will do. Our forms are below.

Define, communicate and evaluate criteria for success

Every year the National Association of Colleges & Employers (NACE) publish a list of attributes most desired of new hires. These could differ among some, but odds are they are the same. With a little adaptation, we use these for midterm and final evaluations by the intern’s direct supervisor.

Responses on the primary criteria (below) are shared with the intern in a meeting with the academic advisor. We also ask about punctuality, attitude, performance, and overall grade from the direct supervisor of the internship at the employer. The entire form may be downloaded here.

Sports Internship Evaluation Criteria

Specific to our own preparation and values, we ask students to be 2nd milers. When asked to do something (walk a mile), go above and beyond expectations (go the second mile). Supervisors rate the intern accordingly (below).

Hold students responsible

Students should perform well in the internship. We expect that.

We also expect them to reflect on what they learn. Keeping a daily or weekly journal is recommended.At the end of the term, students must submit the S3 Internship Report Form (click to download) regarding a weekly log of hours, assignments, volunteering, accomplishments, application of class material, issues (problems or challenges & resolutions), culture, behavioral adaptation, recommendations, and net promoter score rating for the internship.

Review insights & follow-through with students

Meet with each student to get his or her take on the evaluation provided in Step 3. Usually there are no surprises. Employers do a good job of picking up on areas for improvement that you’ve likely noticed in class. So, it’s nice to have someone else see it and say it.

Generally, these are great times to encourage students in careers. On occasion, you can use these to give appropriate kicks in the pants. We’ve seen these have fairly drastic effects on capable students who needed to get with the program. On occasion, you find some who need to find another program. The wide world of sports, perhaps the same as other industries (but we think more so),demands a high level of commitment. We help students by holding them to a high standard.

Conclusion

Providing good internship experiences takes effort on the part of the academic advisor, student, and employer. But, working together, internships are the foundation for successful careers. No class, book or assignment can substitute for on-the-job reality training.

The very best part of what we do is to see students succeed in their careers.

Feel free to borrow, steal, or adapt any or all of the attached materials! If you’ve found other things that work well, please let us know!

Sport Business Analytics: A Review of Harrison & Bukstein’s Book

Sport Business Analytics: A Review of Harrison & Bukstein’s Book
by Kirk Wakefield – January 2017

Business intelligence is old school. Business analytics is new school. Sport business analytics is finally going to school. In the past decade, interest grew beyond the 100 or so nerds at the first MIT Sports Analytics Conference to  sellout crowds (>3000 geeks and wannabes) today. At the same time, courses and programs have emerged to educate tomorrow’s sports business analysts.

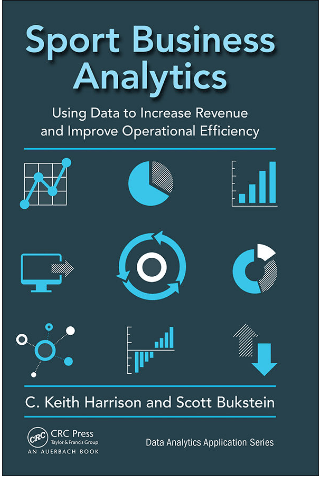
To that end, C. Keith Harrison and Scott Bukstein, of the University of Central Florida, compiled a collection of 13 chapters (plus a chapter on teaching a related class) from professionals and academics for their edited book released by Taylor & Francis, entitled, “Sport Business Analytics: Using Data to Increase Revenue and Improve Operational Efficiency.”

In all fairness, I acknowledge a number of the chapter authors are associates. My intent, then, in this book review is to not treat them as I do my friends, but will instead try to be considerate and complimentary.

The Evolution & Impact of Business Analytics in Sport

The question, “What is analytics? Really?” is often raised among academics. Professors and data scientists tend to think of analytics as using advanced statistical techniques to model and predict behaviors based on (big) data. Practitioners may refer to analytics when they really mean reporting.

In the opening chapter overview of the text, Scott Bukstein states the core purpose of sport business analytics is “to convert raw data into meaningful, value-added and actionable information that enables sport business professionals to make strategic business decisions, which then result in improved company financial performance and a measurable and sustainable competitive advantage.”  In short, analytics is any “data-driven process as well as any actionable insights derived from data.”

Consistent with this understanding, the book chapters provide good case examples of data-driven processes that produce actionable insights. In large part, many of the chapters read as a series of case studies with examples of how organizations implement analytics. The chapters provide instruction to understand what leading teams and companies do on a day-to-day basis, as well as propose thought-provoking ideas for practitioners.

Ticketing Innovation

In Chapter 2, Jay Riola offers replicable examples of how the Orlando Magic use customer data to target and engage fan segments through appropriate digital channels and devices. Other teams would do well to learn from the success of the Magic’s Fast Break Pass and season ticket holder app, as thoroughly explained by Jay in this chapter.

Using ticket pricing analytics, Troy Kirby does a great job explaining how the secondary market is the primary market, in Chapter 3. Troy makes the argument that a ticket may eventually evolve beyond its current revocable license legal status to a material good, allowing greater freedom for fans to use and resell however they wish. The practical upshot of these two chapters is teams must more quickly adapt to digital channels–whether owned by the team or others–to provide value to fans. Teams with NIH attitudes will suffer.

Data Management & Marketing

Ray Mathew offers a basic understanding of how teams use CRM to gather and analyze customer data for use in targeted marketing campaigns in Chapter 4. Since CRM coordinators are typical entry-level positions, interested learners should be motivated to self-learn, intern, or take courses in CRM to prepare for careers in data management in sports. This chapter provides a good foundation for students to understand if this is a viable career path for them.

Michael Farris provides an overview of the Aspire Group’s 8-point ticket marketing, sales and service philosophy in Chapter 5. Academic programs lacking courses in marketing strategy will benefit from the Aspire Group’s marriage of marketing with analytics. Programs housed in business schools will also appreciate founder Bernie Mullin‘s sound approach to management and marketing. The application of the model to the experiences of Georgia Tech are particularly insightful for NCAA programs. Plus, students in classes adopting this text will go into interviews with Aspire knowing what they’re all about!

Research & Applications

Chapter 6 leans closer to the professor or data scientist’s POV of business analytics. Michael Lewis, Manish Tripathi and Michael Byman address the importance of calculating, tracking, and managing customer lifetime value (CLT) and related functions of brand and fan equity. CLV is critical to model retention and seat-buying decisions. The authors present insights into NFL team’s fan equity and social media equity to pinpoint pricing and promotion opportunities. Updates among leagues are available on Michael Lewis’ blog at Emory University (follow link here).

John Breedlove illustrates how teams use analytics to improve the performance of sales reps with targeted campaigns to open the door to warm leads. In this chapter (7), John illustrates the importance of keeping analytics simple to increase efficiency and effectiveness. Combining public (secondary) and private (primary) data can provide insights to make decisions, as when the Tampa Bay Buccaneers used public geodemographic information to help set prices and target customer segments. This chapter provides a good explanation and case study for A/B testing.

Digital Media Analytics

Duke University serves its huge fan base through its crowdsourced data visualization platform know as #DukeMBBStats. Ryan Craig provides an engaging explanation of the process Duke followed to grow the platform. Ryan’s chapter (8) offers direction for other NCAA and pro organizations to create fan profiles to authentically and personally engage fans with effective marketing strategies to enhance renewals.

Michael Lorenc and Alexandra Gonzalez present a fascinating chapter (9) on leveraging digital marketing to drive revenue, relying on data from their employer (Google) to paint a picture of today’s digital buyer. Evidence shows the potential ROI on digital marketing informed by audience, acquisition, and behavioral and conversions data via Google Analytics. You’ll be analyzing your own website and digital marketing before you finish the chapter.

Sponsorship Valuation & Affinity Groups

 Adam Grossman and Irving Rein provide one of the best summaries I’ve read on the state-of-the art in sponsorship valuation. [dropshadowbox align=”right” effect=”lifted-both” width=”200px” height=”” background_color=”#ffffff” border_width=”1″ border_color=”#dddddd” ]”Where audience analysis often fails is the inability to recognize that it is never static.” ~Grossman & Rein[/dropshadowbox] The authors provide descriptions of inherent valuation (profits generated by sponsorship assets), relative valuation (comparing CPMs across channels), and comparable valuation (comparing the price of assets offered by different properties), as well as how best to communicate to particular audiences. In addition to teaching at Northwestern (along with Professor Rein), Adam founded Block Six Analytics, using analytics and technology to help brands and teams generate revenue.

Co-editor C. Keith Harrison of the text, along with Suzanne Malia Lawrence, introduce the concept of “live analytics” in Chapter 11 to study and understand affinity groups and develop marketing plans accordingly. Live analytics, in this case, means distributing surveys during events, collecting and analyzing the results, and then creating innovative ways to engage fans. They provide an example of the Gridiron Girls football clinic at Montana State University. Another good example at the pro level is the Dallas Cowboys 5-Points Blue designed for female fans, based on extensive primary research and analysis of other NFL teams to differentiate the affinity group.

5 Points Blue

Talent Analytics & Data-Driven Storytelling

Brandon Moyer explains how the Aspire Group and others use analytics to hire and develop talent in the business of sports.  At Aspire, they look for employees with WHOPPPP:

  1. Work ethic
  2. Honesty, integrity & character
  3. Openness to learning
  4. Passion for sport business & sales
  5. Production (results)
  6. Positive attitude
  7. Potential for leadership

This chapter (12) provides other examples of how teams and companies (should) use data-driven approaches to hire and evaluate personnel.

Ryan Sleeper illustrates a variety of data visualization approaches to enhance storytelling–or communication–with the intended audience in Chapter 13. Effective visualization reduces time to insight, increases accuracy and improves engagement. The lesson here, again, is: Keep it simple. Ryan offers engaging examples of how to hook an audience–like converting a league standings table into a map to quickly gauge relative team performance. See more of his Tableau tips at his website. While we are at it, we strongly recommend taking a course in Tableau if your goal is to succeed in the business of sports.

Conclusion

Michael Mondello provides a concluding chapter on how to teach a sports business analytics course. Dr. Mondello provides helpful examples of his approach to class relative to content delivery, class assignments,  and exams.

The approach in the Sport Sponsorship & Sales (S3) program is to combine the Sport Business Analytics text (most Mondays) followed by lab instruction (most Wednesdays) using Microsoft Dynamics 365 to learn CRM and marketing automation processes reliant upon analytics. Microsoft IT Imagine Academy provides video instruction for learners at member Microsoft Dynamics Academic Alliance schools. Code Academy offers free courses on related data management topics, such as SQL.

To assist others using the text, below is a list of key terms for each chapter. To give the reader of this review an idea of the concepts and content, the first and last chapter are complete with definitions. The first chapter outline also provides tips on studying, just in case some students are still trying to figure that out. Other chapters contain key terms/concepts only. Feel free to download, edit and use for your own class purposes.


Chapter: Topic
Chapter 1 Evolution and Impact of Business Analytics in Sport
Chapter 2 Analytics and Ticketing Innovations at the Orlando Magic
Chapter 3 Ticket Markets in Sport
Chapter 4 CRM & Fan Engagement Analytics
Chapter 5 Ticket Marketing Sales and Service Philosophy
Chapter 6 Empirical Research Methods
Chapter 7 Data Driven Marketing Initiatives
Chapter 8 Fan Engagement Social Media Digital Marketing Analytics Duke
Chapter 9 Leveraging Digital Marketing to Engage Consumers and Drive Revenue
Chapter 10 Communicating the Value of Sports Sponsorships
Chapter 11 Market Research Analytics
Chapter 12 Talent Analytics
Chapter 13 Visualization is the Key to Understanding Data


What’s new in S3 for 2016-17?

What’s new in S3 for 2016-17?
by Kirk Wakefield – April 2016

April 2016 Newsletter

We have big plans for the 2016-17 academic year. Here’s some of what’s in store!


Friday, November 4, 2016

S3 Senior Pro Day

  • Texas BBQ on Thursday Night:  S3 Advisory Board members meet the students & network with managers the night before interviews.
  • S3 Senior Interviews All-Day Friday: Managers meet each senior for 10 minutes in the morning, speed-dating style; then call back your top draft picks for afternoon interviews.
  • Stay over for the TCU-BU game on Saturday, November 5, 2016.
  • All S3 Advisory board teams and companies are invited to interview our 40 seniors for 2016-17! Board members should feel free to invite HR personnel to join us for the Senior Pro Day!
  • Virtual interviews may also be set-up for those who cannot make the physical trip to Waco.
  • Mark your calendars now. Official invites will arrive via email.

Tuesday & Wednesday, January 17 & 18, 2017

S3 Board Meeting

Based on insights provided by the S3 Executive Council and input from board members, we recognize that focusing on recruiting seniors in November and juniors in January better fits the schedules of many teams and companies. Hiring managers will get to meet every senior at the fall Pro Day and can still interview seniors at the January meetings. An additional benefit is that juniors will have a semester completed in the S3 program and be better prepared to meet board members and interview for internships.

Held right after Martin Luther King Day (1-16-17), the S3 Board meetings will include:

  • Junior Internship Recruitment & Senior Follow-up Interviews:
  • Phillips 66 Banquet & Corporate-Property Networking: Focused time to develop relationships with other S3 Board members.
  • Mentorship Hour: Share career advice with your mentorship group of S3 students. Board members will have the opportunity to volunteer as mentors and role models as a way of giving back to students as they begin their careers.
  • Ticket Insights: Roundtable discussion on pricing analytics presented by new S3 partners Eventellect & Stubhub.
  • Campaign Management: Roundtable discussion on best practices in strategy. Stay tuned, board members, for the opportunity to submit your best campaign strategy to present at the meetings.
  • S3 Brand-Building Brain & Barnstorming: Board members will discuss ways to strengthen and spread the good word about S3, as we continue to grow on a national and international basis.

We thank the S3 Board Members who recruit seniors for full-time positions and juniors for summer internships, as well as provide financial support for the program. We especially thank our anchor (1) corporate partners at Phillips 66, Eventellect, Schlotzsky’s, and La Quinta Inns & Suites, and (2) team partners at the Dallas Cowboys, Houston Texans and Dallas Mavericks. These organizations have gone above and beyond!


Welcome to New Board Members!

Dan Fleetwood, Vice President, Global Sponsorships, SAP

Patrick Ryan, Co-Founder of Eventellect

Geoff Lester, Head of Partnerships & Business Development, StubHub

Katie Scallan, Senior Manager, Engagement Marketing, Gulf States Toyota

Chris Talley, Vice President, Corporate Communications, USAA

Garrett Smith, Manager, National Soccer HOF Club Sales, FC Dallas

Doug McNamee, Senior Associate AD, Baylor

Katy Young, Director of Recruiting, Learfield

We also welcome, Christine Stoffel, CEO, SEAT Consortium, who will share some exciting news with us next month!


This month in the S3 Report we begin features on the culture, values and practices of some of our great team partners. This month, read about the San Antonio Spurs Sports & Entertainment:


Cover Photo: April S3 Club Meeting with San Antonio Spurs Brooke Gaddie (S3 2014) and Lindsay Beale (S3 2010) sharing insights with S3 students.


Increase Season Ticket Renewals by Identifying At-Risk Accounts

Increase Season Ticket Renewals by Identifying At-Risk Accounts
by Daniel Venegas – September 2015

Identifying At-Risk Accounts

Many factors go into the buying decision whenever customers receive renewal invoices.  Team performance, usage, cost, and value are just a few of the buzz words we hear every year.  The issue is knowing which accounts will bring these up and how to identify them beforehand.

Simplifying the renewal process has been one of our paramount objectives for the past three seasons. We focus on identifiers of at-risk accounts.  Team performance is important and measurable, but beyond our control. We chose two metrics to identify at-risk accounts early in the process:

  • Season Ticket Tenure
  • Attendance

Understanding these two elements and what they indicate allows us to influence accounts at the beginning of the season as opposed to waiting to hear objections.

Season Ticket Tenure

You can tell a good deal about customers by how long they have been with the organization.  Over the past two seasons alone we can tell that first year customers are 9% less likely to renew than second year customers and 17% less likely to renew than third year customers.  Obviously, new season ticket holders should be a major focus of your renewal campaign.  You know who they are from the very beginning so there is no excuse for not being proactive with these accounts.

Karlis Kezbers
Karlis Kezbers

“When it comes to first-year season ticket members, education can help drive success.  It’s important to educate the client on every possible aspect to utilize their tickets in the most efficient way.  Don’t assume a first-year account knows everything about their membership.” -Karlis Kezbers (@karliskezbers), Director, Retention and Ticket Operations, Oklahoma City Thunder

Season Ticket Attendance

Attendance at games is another great quantitative measure to identify at-risk accounts.  Customers with an attendance of 61-70% are 6% less likely to renew than those customers that attend 71-80% of games and 9% less likely to renew than customers that attend 81-90% of games.

Tracking attendance early on in a season can help you identify customers that may have issues utilizing their tickets. Be proactive with these accounts and to help them identify ways to better use their tickets.

“The responsibility for getting a ticket used is slowly but surely transferring away from the client and onto the team.”  -Karlis Kezbers (@karliskezbers)

Face to Face: The Throwback Solution

Now that you know the potentially risky accounts, what do you do with them?  You can’t change their tenure.  You may be able to influence their attendance, but probably not much.

Go meet them in person!

Take time out of your week to show customers how much you and the organization care about their business.  It is your job to consult with them on the product you sold.  Let them know 1st year STHs often aren’t aware of the best ways to utilize season ticket benefits compared to tenured accounts.  Walk through the benefits to see how you can help.  Tell customers when you notice they are not utilizing their tickets as frequently as most.  Offer solutions to manage missed games or to better utilize future games.  When you have done this:

Go see them again!

Sam Bays
Sam Bays

Sam Bays, Director of Business Development at the Arizona Coyotes, shares,

“Whether it’s at the arena, in their office, or over a lunch, nothing solidifies the relationship between an AE and a client like a face to face meeting. As a sales professional, the more you can make yourself the ‘face of the franchise’ in the client’s eyes, the more likely they are to renew.”

You may or may not be able to influence attendance or utilization of seats, but your actions influence renewal rates. Accounts that use 61-70% of their tickets renew at a rate 10% higher than average if their reps visit them more than once during the season.  You also can’t change the fact you are working with a first year account, but you can show them the real value they purchased.  First year accounts that have more than one face to face visit from their reps during the season renew at a rate 6% higher than the average rookie account.

Day one of your renewal should be the first day after your deadline.  These numbers are specific to my organization but the relative impact can be the same for you.


Cover photo courtesy of PresseBox.