The students POV on interviews for internships & careers

The students POV on interviews for internships & careers

After the first round of the Baylor S3 Pro Day of virtual recruiting with 30 interviewers, 54 of the students rated each of the interviewers, selected their favorite two interviewers, and commented on one that didn’t go as well as hoped. After the second round of S3 Pro Days on March 5 (click here for more info), we will distribute information to interviewers (who also get the chance to rate the students on their interviewing skills). The S3 Best Interviewer Awards for S3 Sales and S3 Analytics will be announced for the S3 Awards Banquet on April 14.

These evaluations are much like teaching evaluations. We certainly prefer students enjoy the experience. Admittedly, sometimes learning experiences can cause user discomfort. So, good on you as professor or recruiter if you can do both: Supply enjoyable learning experiences that serve the welfare of all parties for both the short and long term. To that end, we offer 45 comments about what students liked best about interviewers, which thankfully outweigh the 24 comments on areas of improvement. Learn as you will from these.


Student POV

Interviews for Sports Sales & Analytics Internships & Careers


45 Areas of Excellence

1.       Intentionally listened and asked good questions.
2.       Asked very thoughtful questions and really answered my questions well.
3.       Most enthusiastic and didn’t make it feel like there was a power difference between him and me.
4.       Most willing to show me things like what they do in Tableau.
5.       Just fun to talk to.
6.       Really easy going and easy to talk to.
7.       They stood out above the rest for their openness while discussing their roles and the company culture at their respective teams. They came across as completely genuine, giving me their unfiltered opinions on their workplace instead of telling me any kind of pitch.
8.       Made me feel instantly comfortable during both conversations I had.
9.       Super genuine and friendly; They were not intimidating at all and very helpful in explaining their role and answering my questions.
10.   Very easy to talk to and did a great job answering any questions I had. I very much enjoyed talking and felt at ease and was disappointed when our time was up.
11.   Asked unique and challenging questions that kept me on my toes.
12.   Was genuine and kind while also getting down to business without any unnecessary conversation.
13.   Very personable and made a hectic time feel relaxed, calm and helpful. Made the conversation feel mutually beneficial which was great. Super informative and helpful.
14.   We had a really great conversation about just life. We shared a lot of similarities; was informational, and I got to walk through my resume.
15.   Took an interest in me beyond my job qualifications and wanted to get to know me better on a personal level. They made me feel like they wanted to speak with me and told me I could reach out any time in the future.
16.   Asked great questions and directed good conversation! Awesome at engaging and made me feel really comfortable.
17.   I was able to see how well they enjoyed not only working in their field but with each other too.  I also felt relaxed in the interview and it was one of the ones that I actually had fun being interviewed.
18.   They were the two most enthusiastic people I talked to.  I made really good connections with both of them. They also were very interested in making it clear that if I were hired that they would invest in my career to the fullest extent.
19.   Was very specific and had the 30 min interview laid out in sections of what to accomplish. I got to do a mock phone sale and a 45sec pitch.
20.   Genuine and engaging during our talk.
21.   Very open to answer any and all questions and truly share passion for the job and role as a manger. Provided an open and transparent look at goals for those new to the organization and what managers seek to get out of them.
22.   They made the conversations really smooth and easy and showed a genuine interest in me.
23.   Was very open and had great energy. Seemed very invested in our interview and even joked around a little bit. Overall a great interview and I was incredibly impressed with the organization.
24.   They gave great insights on what their companies did and gave in-depth analysis of the field of analytics, especially CRM and BI. Also, they made the effort to personally connect with me.
25.   Asked challenging questions and, in the interview, pushed me to do better. Charismatic and has good leadership.
26.   It felt like they were actually interested in getting to know me.
27.   They had amazing humor and personality and seemed really interested in talking to me! They acknowledge all of what I said and asked follow-up questions accordingly. They made the speed dating a lot of fun because it may have been an interview, but it seemed more like catching up with an old friend!
28.   Seemed very interested throughout our entire call and even asked for a second interview to better our connection in order to be a future reference for myself.
29.   Discussed the many ways they took care of employees during the ongoing pandemic, both with their mental health and with their paychecks. Detailed how the team handles the social issues that have become as prevalent as ever in recent times.
30.   Open, friendly, and honest. Made me feel more comfortable.
31.   Extremely genuine and excited to hear about why I want to get into sports. They asked very good questions and went into detail when answering questions that I asked about their organizations. Both came across as wanting to help me in my journey in any way they could.
32.   Very interested in me and my future goals, very engaging.
33.   Super high energy and gave me an awesome description of time with the team. Super helpful and seemed genuinely interested in my career growth.
34.   Asked questions about my personality and we were able to chat and have a great conversation!
35.   Gave me a whole lot of advice on how I could answer interview questions better. Offered to connect me with other people within the organization, which was awesome.
36.   Truly took the time to know me and understand what I was looking for in a future job opportunity.
37.   Very encouraging.
38.   Let us know that no matter what happens they were here to help us. Even if that means we go for a decision and it does not include their organization. That is admirable.
39.   Took the time to know me knowing that I am only a sophomore yet was intrigued when looking at my LinkedIn profile. So kind and just wanting to help.
40.   Extremely kind, was prepared with knowledge about me, insightful answers to my questions, willing to help, relatable.
41.   Very interested in what I had to say and gave me great advice.
42.   Very kind and helpful.
43.   Gave great advice, flowing conversation, tremendous insight into job and analytics in sports. Willing to help.
44.   Seemed very genuine in wanting to get to know us. Gave me some valuable advice and perspective.
45.   We had a fantastic conversation about the importance of mental health in the workplace (and in general) and the emphasis put on it.

24 Areas of Improvement

1.       Really didn’t have much of an interview experience. It was too casual.
2.       Questions were very vanilla. Couldn’t get a good read off them.
3.       Didn’t really seem like they wanted to be there.
4.       Wasn’t easy to talk to.
5.       I sort of felt like I had to lead the conversation, where with the other recruiters, they were the ones guiding it.
6.       Seemed not to take our 10-minute call seriously. Never made eye contact and was constantly looking around the room. Gave cookie-cutter monologue and nothing more.
7.       Asked very structured concrete questions. I heard from others that they kept people over time and shorted others. Didn’t appear open.
8.       Informational but it was very cold. It wasn’t a natural conversation like the rest of my 10 min talks.
9.       Rapid fire questions, less conversational interview (granted, we only had 10 minutes).
10.   Asked a lot of questions that didn’t pertain to anything important and also not related to S3 or internships.
11.   Did not feel a connection with the organization or interviewer specifically.  Nothing against, is a great person.  I just did not find myself enjoying the interview or the chemistry.
12.   A stand-in for my interview didn’t seem too ecstatic to be there. Seemed very dry.
13.   Not very engaging and didn’t show a lot of emotion.
14.   Had one short interview where I was asked very off-topic and slightly offensive questions.
15.   I was confused on the style of the interview. Seemed harsh.
16.   Seemed very distracted; like the focus was elsewhere from the start. It threw me off a little bit and it felt like we never really got into the interview at all.
17.   Didn’t have a lot of emotion and didn’t seem that interested in talking to me. It felt like more they were just doing this to put a check mark on their calendar.
18.   Felt more like an actual interview and less of a conversation. It was intense, which is fine, but I enjoyed some other conversations more since they were more chilled.
19.   Conversation was not engaging and was not very interested in me or what I was saying.
20.   Didn’t really seem very interested in being at the event. Wasn’t super open about time with organization, which made the interview pretty difficult to stay engaged with.
21.   Not all that open to talking much about the organization and the conversation was hard to get through.
22.   Impersonal and mechanical conversation. Improved in the second round of interviews but felt like they were checking boxes rather than trying to make a connection or be a resource.
23.   Typing the entire time.
24.   It was so awkward; I was given short answers to questions that I asked.

Do MLB giveaways and special events influence attendance?

Do MLB giveaways and special events influence attendance?
by Kirk Wakefield – October 2018

Forbes reported before the 2018 season started that clubs planned over 1800 special event promotions, including about 28 giveaways per team on average. The Cardinals (49), Dodgers (42), and Cubs (41) all topped 40 giveaways. The Marlins (11), Athletics (14), and Diamondbacks (15) were the least giving. If you’re already seeing a pattern, you may be onto something.

Not everyone follows MLB attendance with the same passion as I do. I’ve been tracking and analyzing MLB attendance trends decade by decade since 1990. In the 1990s and early 2000s, it was the rash of new stadiums drawing fans to the game. As we move into the current decade, the strongest predictor of attendance is the presence of star players (represented by total payroll) and the fact that each new year brings overall lower attendance. Winning has always been important, but always behind star power and stadium-related factors (including capacity). Ticket prices, as we’ll see shortly, rarely influence annual attendance. Instead, we can reliably predict next year’s prices based on this year’s attendance.

What about giveaways and special events?

We don’t have historical, annual data on the number of giveaways and special events offered by team. But, thanks to Forbes, we have them for 2018.

It’s not enough to ask, “Are more giveaways and special events correlated with attendance?” You must account for anything else that might influence attendance. Thankfully we did this for you.

To explain average attendance (right) we include the following factors for each team:

  1. Total payroll in dollars
  2. Won/loss percentage
  3. Stadium capacity
  4. Special Events
  5. Giveaways
  6. Population/Franchise Index 1
  • Fan Cost Index (see Team Marketing)
  • Park factors: Runs scored; Home runs


The results

We can explain 91.3% of the variance in attendance with these factors. If you think that is high, you are correct. We rarely explain over 90% of anything. If you’d like to play with the data yourself, click here to download. 2

We numbered the factors above for a reason. They represent, in order, those factors with the most influence on attendance. Total payroll (B = .411), winning (B = .328), and size of the stadium (B = .313; i.e., bigger stadiums like the Yankees and Dodgers) each strongly predict average attendance.

Special events (B = .224) and giveaways (B = .198) significantly influence attendance (p < .05). But, not so fast. We took a deeper dive on the relationship of giveaways on attendance. The relationship is not linear.


As most readers likely guessed, what we see is the classic sideways-S curve of a cubic function. Ok, maybe you don’t hit these kinds of curves very well. But, you can see from the graph that teams offering few giveaways (e.g., Marlins and A’s) fared poorly.  As teams offer 10-20 giveaways, attendance increases. However, the dip in the curve shows a good many teams with 20-40 giveaways actually decrease in attendance. This is bad.

What is good? Going all out. The teams offering 40 or more fared very well. This finding is consistent with the philosophy of making the big even bigger. Rather than using promotions only to shore up lousy games, make the big game weekends too big to ignore. The spillover excitement offers a windfall to attendance overall.

What is better? More giveaways and special events give fans more reasons to go. Without, you’re just selling baseball. With, you’re selling entertainment. Want baseball fans to bring less motivated family members and friends? Give them a reason. Many reasons.

The unconvinced are saying, well, those are the Dodgers, Cubs and Cardinals. They have bigger or better stadiums, or winning teams, or maybe bigger markets. We accounted for all of that, remember? These numbers don’t lie. The number of giveaways explain or predict attendance (apart from everything else), and the effect increases at an increasing rate.

Conclusion

The results also show that special events significantly increase attendance. Teams like the Padres (172), Brewers (136), and Royals (126) benefitted from these appeals to different market segments to increase attendance above what it would have been without them. We can argue those with the fewest special events (Red Sox, Mets & Yankees) didn’t need them because of the other factors going in their favor. What might they have done with them?

Finally, it’s always interesting to note the cost of going to the game doesn’t influence average attendance. Neither did any of the park factors, like runs scored or home runs. The total market size and inter-city rivalries help attendance, but just as it has from 1990-2015, it is the least (although significant) effect.


  1. The PFI accounts for larger markets + total major league franchises in the DMA. The New York teams lead the way with the largest population and the most (9) major league teams.
  2. To get 91.3% R-Squared you need to include the quadratic and cubic functions for giveaways.

Do you have your P’s in order?

Do you have your P’s in order?
by Kirk Wakefield – January 2018

People. Purpose. Performance. (Pictures.)

S3 2018 Board Meeting

Paul Epstein challenged the room of executives, managers and students to truly put people first. With over a decade of managerial experience in pro sports, most recently as Director of Sales at the San Francisco 49ers, Paul shared how their sales organization was transformed by helping people “find their WHY.” When organizations put people and purpose first, performance takes care of itself.

Tim Salier, Vice President of Franchise Operations at Spurs Sports & Entertainment, shared how the Austin Spurs G-League team faced high sales force turnover and low productivity. Putting people first, the sales structure was flattened, base salaries of account executives increased above $30,000 and career planning began with stretch assignments to strengthen skill sets in other areas. The results? Revenue rose 300% and more sales reps stayed in place after rampant turnover in the years prior.

Putting Your Money Where…

Chase Jolesch, Director of Ticketing & Premium for the Vegas Golden Knights, stated, “If people truly come before purpose and performance, we must act upon it. We can’t say we care and then ask people to work for less just because it’s sports.”  Shawn McGee, Vice President of Sales & Marketing at Homestead Miami Speedway added:

U.S. Compensation Across All Industries

I’ve seen both sides—low base and high commission and higher base with less commission. In the past, I fully subscribed to mitigating risk by paying a lower base and providing a more substantial commission, as well as forcing the salespeople to drive revenue in order to increase compensation.  However, at my current company, we pay a higher base and little commission.  At first I thought it would lead to lazy salespeople and lack of urgency to hit numbers. We actually found it allows us to source better talent who are still driven to reach the goals…and we can retain those sales people.

Research from the NBA suggests sales reps accept positions with a team for the potential career path and that a lack of clear career path is the main reason for leaving. We agree. Millennials, like most of us, want to be a part of something bigger than ourselves. We want to see a future and purpose in what we do.

Some studies report compensation is rarely a reason for entering a sports sales career. That’s because starting salaries are often far below other industries. The table (right) offers pay comparisons to similar positions across all industries (i.e., not sports). If we want the top talent, will we get it by paying under market rates? If we want to maximize revenue, can we do that by offering the minimum?

Those on the brand, data and agency side of sports are largely competitive with the general market. We look forward to those responsible for ticket sales to lead the way in attracting and keeping top talent.

Leadership Style

As leaders it comes down to our own personal purpose, values and approach to managing and leading others. Do we see our relationship with employees as more parent-child (Theory X) or adult-adult (Theory Y)? Which do you think achieves the best results with today’s generation? (Hint: Same as when this first came out in 1960. You have to know your Y.)

People are different. Some more different than others. We think most S3 graduates are ready to perform, but variance exists. Learning new skills requires more direction, but once learned need more support and coaching. Research shows over half of leaders use the same leadership style regardless of situation or person, which translates into not meeting the needs of employees at least half the time.

Situational leadership adjusts to the person-situation. The best leaders know when to delegate, support, coach or direct, based on the employee’s skill development. (See Situational Leadership Model below.) Managers who put people first focus on knowing individuals, what makes them tick (their why) and adapt to meet their needs. Results follow.

Source: KenBanchard.com

The Spurs Sports & Entertainment (SSE) organization puts situational leadership into action. When Allen Schlesinger took an innovative approach to social selling that gave up on cold-calling leads, SSE unleashed Allen to become the leading revenue generator in the NBA’s developmental league (now G-league).

The Cost of Leadership Failure

Replacing a sales rep takes 3-4 months and typically costs at least 150% of the reps’ compensation in lost revenue and added recruiting & training costs. We might have a different view of turnover if we pictured $75,000 walking out the door each time one leaves.

Average turnover in sales across all industries generally hovers around 25% each year. Common thinking is (a) if turnover is over 25%, the problem is management not the employees, and (b) employees leave managers not companies.

Why do employees leave managers? In the sports industry, not unlike others, we promote the best salespeople to become managers. Unfortunately, great sales people make terrible sales managers, as about 1 in 6 suited for sales are good fits for management. We know this is true in sports–the best players are rarely good coaches or managers–so why do we think it works in business?

The Secret of Success

The good news is other ways work. Members of the S3 Advisory Board, like Eric Platte at the Atlanta Hawks, have sales management training programs that identify quality candidates with the right mixture of sales competency and openness to servant leadership to develop into future managers.

The 49ers Sales Academy is a result of a culture shift based on People–Purpose–Performance, in that order. How did they transform the sales force?

First, the focus changed from a “manage up or out” to a retention approach. They asked, “How can we find people who have not only the basics to succeed but whose strengths can shine in the organization for years to come?” The search is for great talents, great people–those who want to do something special.

Second, they took the external sales philosophy of “every seat has a story” for customers and applied it internally to employees. In recruiting, that means taking deep dives into why they are in this business and their values that determine how they do what (sell) they want to do.

Third, once a part of the team, management continues the process of starting with WHY to engage and listen to employees to identify themes to incorporate systems and behaviors to accomplish purposes important to employees. (See diagram, right.) Performance is not the objective, but the result of a people→purpose orientation.


Thanks again to Paul Epstein for bringing these words and illustrations to life–and who now continues his journey to inspire others at the BW Leadership InstituteAre you interested in learning more about the Center for Sports Sponsorship & Sales (S3) at Baylor? Do you identify with the WHY & HOW of what you’ve just read–and want to join us? Visit www.Baylor.edu/Business/S3Thanks to those who traveled to Waco to experience record-breaking cold. Check out your pics below! Click on one to begin the slide show.


Does Grit Lead to High Performance in Sales?

Does Grit Lead to High Performance in Sales?
by Kirk Wakefield – June 2017

What is Grit?

Angela Duckworth made an industry out of her own passion and perseverance toward a long-term goal–her definition of grit–and measuring it in others.

Controlling for other factors (SAT scores, IQ, self-control, and the Big 5 personality traits), she and her colleague’s research[ref]Duckworth, Peterson, Matthews & Kelly (2007), “Grit: Perseverance and Passion for Long-Term Goals,” Journal of Personality & Social Psychology.[/ref] found the grit items (click here to see if you have grit) to be good predictors of performance among spelling bee contestants, Ivy league students and West Point cadets. Gritty children work harder and longer, performing better in national spelling bees. Gritter students attain higher levels of education among those of the same age, but grit does appear to increase as we get older.[ref]Duckworth &  Quinn (2009), “Development and Validation of the Short Grit Scale,” Journal of Personality Assessment.[/ref]Gritty cadets are more likely to complete training. Those with more grit experience fewer lifetime career changes.

The question is: Is grit a good predictor of sales performance in professional sports? In particular, accounting for popular DISC behavioral measures and factors under sales management’s control, does measuring grit offer potential help in recruiting and retention of salespeople?

The Study

Data were collected from 307 salespeople (89% < 4 years experience; 67% males; 98% with at least college degrees) and 34 managers from 18 professional teams in MLB, NBA, MLS, NFL, and NHL. Respondents provided demographics and completed measures of:

  1. DISC behavioral profile
  2. Grit
  3. Impression management (to account for social desirability bias)
  4. Adaptive selling skills
  5. Extent of sales training provided by the organization
  6. Confidence in selling skills
  7. Job satisfaction
  8. Sales performance relative to others in department (dollar sales, new packages, major accounts, exceeding targets, helping supervisor & dept hit goals)
  9. Selling effort relative to others in the department (hours, effort, contacts made)

Different from other studies, we collected sales performance and effort evaluations on exactly the same items (#8 & #9) from the direct supervisors of each sales representative. Each sales manager examined current sales performance (in dollars), rank ordered those in the department, and then completed the performance evaluations for the first quarter of the 2017 year. In total, we were able to match 288 responses (i.e., inside sales and account executives) with supervisor evaluations. [ref] We conducted a second study among sales staff (N = 144) across the entire East Coast Hockey League with similar results. [/ref]

The Results of Grit

The types of achievements studied by Duckworth each culminated in an event (i.e., completing college, West Point, or a Spelling Bee). A sales career is a series of continuous competitions, where standings update daily, and the conclusion uncertain. Does grit directly predict performance?

Among salespeople in professional sports, grit indirectly influences sales performance in two important ways:

  1. Grittier salespeople give relatively more effort than other salespeople, including hours spent selling and the total number of contacts made. In turn, effort (work ethic) drives performance in this data.
  2. Grittier salespeople are more satisfied with their jobs, which means lower turnover. Satisfied salespeople give more effort, which leads to higher performance.

Bottom line: Hire gritty salespeople. Use the grit scales as one input in recruiting. Mean grit score among cadets (3.75) and our study (3.82) would be a good baseline.

Grit scores at the highest levels may be a function of impression management, saying what we want to hear. But, either way, people who say they have more grit are evaluated by their managers as giving more effort. In a battery of measures, grit scores offer insight. [ref]If potential reps willingly admit having little grit (i.e., scores low on the grit scale), you should believe them.[/ref]

The Effects of DISC Behavioral Styles

This study largely confirms what we found before regarding DISC behavioral styles among salespeople, with some additional insights. Salespeople with more dominant behavioral styles (High D’s) perform better than those with low dominance traits.  Why? The data shows:

  1. High D’s are more likely to be confident in their sales skills.
  2. High confidence in selling skills is a strong predictor of performance.
  3. High D’s are more likely to use adaptive/consultative selling.
  4. High C’s are less likely to use adaptive/consultative selling.

Bottom line: Use DISC behavioral profiles for recruitment and development. But, be careful: Some high SCs (low D) can be very competitive and have the ability to focus on goals. Confidence in selling skills is a much stronger predictor of performance than DISC behavioral styles. The good news is good sales training builds confidence.[ref] In other words, good salespeople are born, but you can also raise them.[/ref]

The Effect of Sales Training

Effective sales training helps salespeople know how to: (Average grade across all teams.) [ref] For measures, see: Sujan, Weitz, and Kumar (1994), “Learning Orientation, Working Smart and Effective Selling,” Journal of Marketing. [/ref]

  1. Interact with customers (92)
  2. Provide appropriate service levels (88)
  3. Behave with customers (92)
  4. Handle objections (89)
  5. Handle unusual problems/situations (80)
  6. Deal with criticism (85)
  7. Present specific team strengths (86)
  8. Highlight specific benefits (91)

[dropshadowbox align = right width = 40%] Adaptive selling skills (disagree/agree; *reverse scored):

  1. Each customer requires a unique approach.
  2. When I feel that my sales approach is not working, I can easily change to another approach.
  3. I like to experiment with different sales approaches.
  4. I am very flexible in the selling approach I use.
  5. I feel that most buyers can be dealt with in pretty much the same manner.*
  6. I don’t change my approach from one customer to another. *
  7. I use a set sales approach. *
  8. I find it difficult to change my presentation style to certain buyers.*[/dropshadowbox]

Overall, reps positively rated sales training. But, being good is not good enough. The more profound effects on sales confidence are at the highest levels: We found training needs to be excellent (90+) to help reps exude confidence. The data also shows effective sales training increases goal clarity and adaptive selling skills. The latter has a huge (statistically speaking) effect on sales confidence.

Bottom line: Focus sales training on adaptive selling skills, particularly in dealing with difficult situations with critical customers. Include the adaptive selling skills scale to your recruiting toolbox.

Do Salespeople Deceive Themselves?

In a word, yes. Nearly 70% of the sales reps rated themselves higher on the very same questions we asked managers about each one. Some by a lot.  In fact, on a scale ranging from -5 (much worse than others in the department) to +5 (much better than others in the department), 55% of reps rated themselves one point higher than their managers did on all items. About one-third rated themselves two whole points or higher than their managers did.

What does this matter? The strongest effect on sales performance and sales effort by far is the margin between self-evaluation and manager evaluation. Sales confidence, DISC profiles and effort all significantly help predict the manager’s performance evaluation. None come close to the effects of being in touch with reality. Those with perceptions closest to (furthest from) their managers are the best (worst) performers.

Bottom line: If one-third of reps are clueless about their performances and more than one half widely overestimate relative performance, how well are we communicating? Given industry turnover issues, we expect more intentional and consistent one-on-one professional development and career goal setting meetings would reduce the deception gap and improve performance.

Conclusion

Grit does not have a direct effect on sales performance, but does help predict effort and job satisfaction. Effort leads to performance. Satisfaction leads to low turnover.

DISC behavioral styles offer guidance in knowing who will succeed. However, since sales confidence improves with experience and training in adaptive selling, DISC profiles should be only one factor considered in hiring.

Our view is that the DISC is better suited to teach adaptive selling and to get people in the right seats on the bus. Further, the DISC scales exhibit poor psychometric dimensions–which we are refining. If your organization would like to participate in the next round of studies with improved DISC scales, grit measures, and our impression management scales (AKA BS Meter), please contact us here.


How Managers Can Use this Research

Based on conference calls to review the research with participants, some offered comments on action plans.


Shawn McIntosh
Brett Zalaski

Brett Zalaski, Vice President Ticket Sales & Service, and Shawn McIntosh, Senior Manager of Inside Sales, Houston Dynamo

As someone who believes in continued learning and training, we loved seeing that confidence was so closely linked to a rep’s job satisfaction.

Markets change and the people we sell to are constantly evolving.  As sales managers it is critical to continue to focus on adaptive selling skills in order to keep our reps confident and happier.

Kris Dolen
Mark Johnson

Kris Dolen, Sales Manager, and Mark Johnson, Guest & Member Relations Manager, Tampa Bay Buccaneers

This research is extremely insight. We are excited to do more digging into the research and the works of Angela Duckworth. Our two biggest takeaways:

  1. Great questions to use for 1-on-1’s with each member of our team are to ask: “On a 1-10 scale, where 1 is the worst and 10 is the best,
    1. Where do you think you stand among your peers?
    2. Where do think your peers would rank you?
    3. Based on my score for you of (X), what do you need to do to get from where you are to where you want to be?”
  2. Understanding the DISC profiles:
    1. Will help me become more self-aware of the different styles among team members.
    2. Will help with Situational Leadership of my team, which is a great way to train & build confidence.
Rob Erwin

Rob Erwin, Director of Ticket Sales, Dallas Mavericks

This study gave our management some new concepts to consider with regards to recruiting and retaining a best in class staff.  I intend to apply more questions during the interview process to discover the candidate’s measure of grit.  I hope this will in turn help better predict their effort once they move past the honeymoon portion of their hiring.  Separately, given the statistics on reps deceiving themselves, I will continue to evaluate how we can clearly communicate with our staff regarding their individual performances.

Geno Fata

Geno Fata, Manager of Inside Sales, Arizona Diamondbacks

After reading “Grit” by Angela Duckworth last year, I’ve been increasingly curious as to how grit applies in a sports sales setting.  My hunch was “grittier” sales reps would be more likely to succeed over their less gritty peers.  It is valuable to know that in a sports sales setting, grit heavily influences both effort and job satisfaction, as those are two crucial indicators of success in our program.

We plan to use takeaways from this study in a few different ways – evaluating grit both in candidates and our current sales reps by administering the Grit Scale, and supplementing it with a few supporting questions that will either reinforce their Grit Score, or call it into question.

The study is also a great reminder of the importance of quality and on-going training, and regular perception vs. reality exercises between sales reps & managers – making sure our reps perceptions of their performances are on par with our evaluations of them.

Sport Business Analytics: A Review of Harrison & Bukstein’s Book

Sport Business Analytics: A Review of Harrison & Bukstein’s Book
by Kirk Wakefield – January 2017

Business intelligence is old school. Business analytics is new school. Sport business analytics is finally going to school. In the past decade, interest grew beyond the 100 or so nerds at the first MIT Sports Analytics Conference to  sellout crowds (>3000 geeks and wannabes) today. At the same time, courses and programs have emerged to educate tomorrow’s sports business analysts.

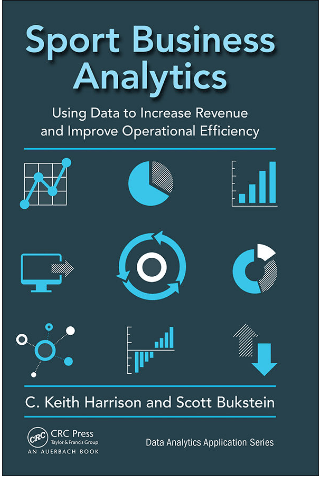
To that end, C. Keith Harrison and Scott Bukstein, of the University of Central Florida, compiled a collection of 13 chapters (plus a chapter on teaching a related class) from professionals and academics for their edited book released by Taylor & Francis, entitled, “Sport Business Analytics: Using Data to Increase Revenue and Improve Operational Efficiency.”

In all fairness, I acknowledge a number of the chapter authors are associates. My intent, then, in this book review is to not treat them as I do my friends, but will instead try to be considerate and complimentary.

The Evolution & Impact of Business Analytics in Sport

The question, “What is analytics? Really?” is often raised among academics. Professors and data scientists tend to think of analytics as using advanced statistical techniques to model and predict behaviors based on (big) data. Practitioners may refer to analytics when they really mean reporting.

In the opening chapter overview of the text, Scott Bukstein states the core purpose of sport business analytics is “to convert raw data into meaningful, value-added and actionable information that enables sport business professionals to make strategic business decisions, which then result in improved company financial performance and a measurable and sustainable competitive advantage.”  In short, analytics is any “data-driven process as well as any actionable insights derived from data.”

Consistent with this understanding, the book chapters provide good case examples of data-driven processes that produce actionable insights. In large part, many of the chapters read as a series of case studies with examples of how organizations implement analytics. The chapters provide instruction to understand what leading teams and companies do on a day-to-day basis, as well as propose thought-provoking ideas for practitioners.

Ticketing Innovation

In Chapter 2, Jay Riola offers replicable examples of how the Orlando Magic use customer data to target and engage fan segments through appropriate digital channels and devices. Other teams would do well to learn from the success of the Magic’s Fast Break Pass and season ticket holder app, as thoroughly explained by Jay in this chapter.

Using ticket pricing analytics, Troy Kirby does a great job explaining how the secondary market is the primary market, in Chapter 3. Troy makes the argument that a ticket may eventually evolve beyond its current revocable license legal status to a material good, allowing greater freedom for fans to use and resell however they wish. The practical upshot of these two chapters is teams must more quickly adapt to digital channels–whether owned by the team or others–to provide value to fans. Teams with NIH attitudes will suffer.

Data Management & Marketing

Ray Mathew offers a basic understanding of how teams use CRM to gather and analyze customer data for use in targeted marketing campaigns in Chapter 4. Since CRM coordinators are typical entry-level positions, interested learners should be motivated to self-learn, intern, or take courses in CRM to prepare for careers in data management in sports. This chapter provides a good foundation for students to understand if this is a viable career path for them.

Michael Farris provides an overview of the Aspire Group’s 8-point ticket marketing, sales and service philosophy in Chapter 5. Academic programs lacking courses in marketing strategy will benefit from the Aspire Group’s marriage of marketing with analytics. Programs housed in business schools will also appreciate founder Bernie Mullin‘s sound approach to management and marketing. The application of the model to the experiences of Georgia Tech are particularly insightful for NCAA programs. Plus, students in classes adopting this text will go into interviews with Aspire knowing what they’re all about!

Research & Applications

Chapter 6 leans closer to the professor or data scientist’s POV of business analytics. Michael Lewis, Manish Tripathi and Michael Byman address the importance of calculating, tracking, and managing customer lifetime value (CLT) and related functions of brand and fan equity. CLV is critical to model retention and seat-buying decisions. The authors present insights into NFL team’s fan equity and social media equity to pinpoint pricing and promotion opportunities. Updates among leagues are available on Michael Lewis’ blog at Emory University (follow link here).

John Breedlove illustrates how teams use analytics to improve the performance of sales reps with targeted campaigns to open the door to warm leads. In this chapter (7), John illustrates the importance of keeping analytics simple to increase efficiency and effectiveness. Combining public (secondary) and private (primary) data can provide insights to make decisions, as when the Tampa Bay Buccaneers used public geodemographic information to help set prices and target customer segments. This chapter provides a good explanation and case study for A/B testing.

Digital Media Analytics

Duke University serves its huge fan base through its crowdsourced data visualization platform know as #DukeMBBStats. Ryan Craig provides an engaging explanation of the process Duke followed to grow the platform. Ryan’s chapter (8) offers direction for other NCAA and pro organizations to create fan profiles to authentically and personally engage fans with effective marketing strategies to enhance renewals.

Michael Lorenc and Alexandra Gonzalez present a fascinating chapter (9) on leveraging digital marketing to drive revenue, relying on data from their employer (Google) to paint a picture of today’s digital buyer. Evidence shows the potential ROI on digital marketing informed by audience, acquisition, and behavioral and conversions data via Google Analytics. You’ll be analyzing your own website and digital marketing before you finish the chapter.

Sponsorship Valuation & Affinity Groups

 Adam Grossman and Irving Rein provide one of the best summaries I’ve read on the state-of-the art in sponsorship valuation. [dropshadowbox align=”right” effect=”lifted-both” width=”200px” height=”” background_color=”#ffffff” border_width=”1″ border_color=”#dddddd” ]”Where audience analysis often fails is the inability to recognize that it is never static.” ~Grossman & Rein[/dropshadowbox] The authors provide descriptions of inherent valuation (profits generated by sponsorship assets), relative valuation (comparing CPMs across channels), and comparable valuation (comparing the price of assets offered by different properties), as well as how best to communicate to particular audiences. In addition to teaching at Northwestern (along with Professor Rein), Adam founded Block Six Analytics, using analytics and technology to help brands and teams generate revenue.

Co-editor C. Keith Harrison of the text, along with Suzanne Malia Lawrence, introduce the concept of “live analytics” in Chapter 11 to study and understand affinity groups and develop marketing plans accordingly. Live analytics, in this case, means distributing surveys during events, collecting and analyzing the results, and then creating innovative ways to engage fans. They provide an example of the Gridiron Girls football clinic at Montana State University. Another good example at the pro level is the Dallas Cowboys 5-Points Blue designed for female fans, based on extensive primary research and analysis of other NFL teams to differentiate the affinity group.

5 Points Blue

Talent Analytics & Data-Driven Storytelling

Brandon Moyer explains how the Aspire Group and others use analytics to hire and develop talent in the business of sports.  At Aspire, they look for employees with WHOPPPP:

  1. Work ethic
  2. Honesty, integrity & character
  3. Openness to learning
  4. Passion for sport business & sales
  5. Production (results)
  6. Positive attitude
  7. Potential for leadership

This chapter (12) provides other examples of how teams and companies (should) use data-driven approaches to hire and evaluate personnel.

Ryan Sleeper illustrates a variety of data visualization approaches to enhance storytelling–or communication–with the intended audience in Chapter 13. Effective visualization reduces time to insight, increases accuracy and improves engagement. The lesson here, again, is: Keep it simple. Ryan offers engaging examples of how to hook an audience–like converting a league standings table into a map to quickly gauge relative team performance. See more of his Tableau tips at his website. While we are at it, we strongly recommend taking a course in Tableau if your goal is to succeed in the business of sports.

Conclusion

Michael Mondello provides a concluding chapter on how to teach a sports business analytics course. Dr. Mondello provides helpful examples of his approach to class relative to content delivery, class assignments,  and exams.

The approach in the Sport Sponsorship & Sales (S3) program is to combine the Sport Business Analytics text (most Mondays) followed by lab instruction (most Wednesdays) using Microsoft Dynamics 365 to learn CRM and marketing automation processes reliant upon analytics. Microsoft IT Imagine Academy provides video instruction for learners at member Microsoft Dynamics Academic Alliance schools. Code Academy offers free courses on related data management topics, such as SQL.

To assist others using the text, below is a list of key terms for each chapter. To give the reader of this review an idea of the concepts and content, the first and last chapter are complete with definitions. The first chapter outline also provides tips on studying, just in case some students are still trying to figure that out. Other chapters contain key terms/concepts only. Feel free to download, edit and use for your own class purposes.


Chapter: Topic
Chapter 1 Evolution and Impact of Business Analytics in Sport
Chapter 2 Analytics and Ticketing Innovations at the Orlando Magic
Chapter 3 Ticket Markets in Sport
Chapter 4 CRM & Fan Engagement Analytics
Chapter 5 Ticket Marketing Sales and Service Philosophy
Chapter 6 Empirical Research Methods
Chapter 7 Data Driven Marketing Initiatives
Chapter 8 Fan Engagement Social Media Digital Marketing Analytics Duke
Chapter 9 Leveraging Digital Marketing to Engage Consumers and Drive Revenue
Chapter 10 Communicating the Value of Sports Sponsorships
Chapter 11 Market Research Analytics
Chapter 12 Talent Analytics
Chapter 13 Visualization is the Key to Understanding Data


The Online Ticket Buyer: By the Numbers

The Online Ticket Buyer: By the Numbers
by Kirk Wakefield -October 2016

Nationwide Study of Recent Online Ticket Buyers

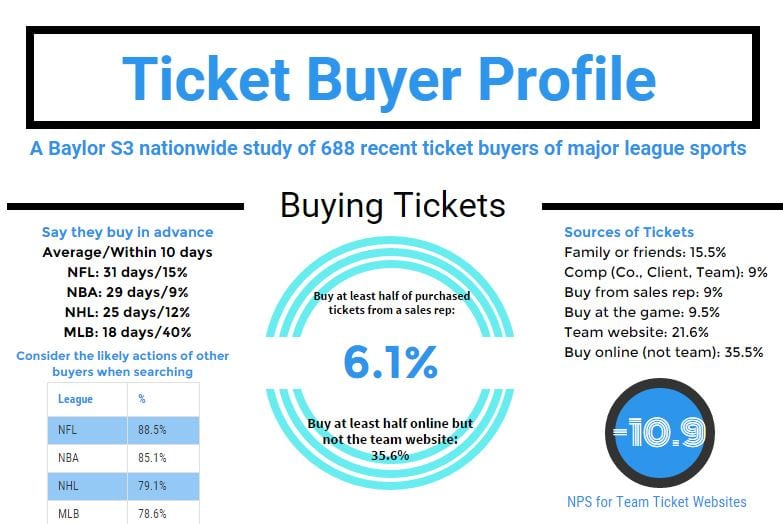
Efficient and effective salespeople convert ticket buyers into season ticket holders and serve their needs. However, the secondary market is the primary market for many fans who do not differentiate between buying from StubHub, TicketMaster or the team’s website. What do these buyers look like? How do they buy? Where do they buy? What is important to them?

The Online Ticket Buyer Profile infographic offers an overview of our initial findings from a wide-ranging study of 688 recent online ticket buyers of tickets. Given the time of year and panel source, we draw primarily from NFL, MLB, and NBA ticket buyers, but also have representation from NHL and a few MLS buyers. All bought tickets within the past 12 months.

We will present more in-depth results and insights at the Baylor S3 Annual Board meeting, January 17-18, 2017. Students will present analysis & insights to the industry on December 5, 1-4pm. Guest judges are welcomed.


Why the best teams and brands partner with academics

Why the best teams and brands partner with academics
by Kirk Wakefield – August 2014

Back in the early 1990’s, I started out with my Baseball Almanac contacting major and minor league teams to conduct research. Being at Ole Miss during that time, just an hour south of Memphis, I made quick friends with every pro franchise that came through town–among them the Memphis Chicks, Memphis MadDogs (CFL), Memphis Fire (USBL), and Memphis Redbirds, where I managed their fan research for three summers before leaving for Baylor in 2002.

During the ’90s, I recall a visit with a vice-president of marketing at a MLB team in the northeast about collaborating on fan research. He thought it was all very interesting, but said they weren’t interested because, “We already did one fan survey this year.”

Times have changed and MLBAM has taken the league and its teams to the front of the class in understanding its fans. However, one paradox I learned still holds today:

[dropshadowbox align=”center” effect=”lifted-both” width=”300px” height=”” background_color=”#ffffff” border_width=”1″ border_color=”#dddddd” ]

The best organizations always want to know more and the struggling rarely want help.[/dropshadowbox]

Why do the best get better?

Derek Blake
Derek Blake

Everyone who’s read “Good to Great” knows that the best leaders have an intense drive coupled with humility. This combination is what makes any leader get better because first they want to and second they know they don’t have a corner on knowledge. Derek Blake, Vice President, Partnership Marketing, La Quinta Inns & Suites, demonstrates this kind of leadership. Derek shares how this plays out in working with educators,

Business today is always evolving and we want to be on the cutting edge.  Working with academics who are experts in a very specific field of study – like corporate partnerships – just makes sense.  By giving back to our educational institutions, we help build the foundation of who students become in the future and that’s where we all benefit.

Some of the greatest franchises in the world are literally right up or down the road from us here in Waco and they always want to learn more. Some might think the San Antonio Spurs have accomplished all they need to after five NBA titles and operating above 99% attendance capacity. But from the top to the bottom of that organization, they always want to get better and are always open to new ideas, new methods, and new approaches to satisfy and grow the fan base.

Eric Sudol
Eric Sudol

The Dallas Cowboys are the NFL’s most valuable franchise, but their executives never hesitate to explore new ideas and to partner with us on research and classroom projects. Eric Sudol, Sr. Director, Corporate Partnerships Sales & Service at Dallas Cowboys, adds, “Teams are always busy and we can save time and money by partnering with academics when our interests overlap with their research needs.”

Much the same can be said of Baylor’s other partners around the state, both corporate and sports organizations. Further, aggressive teams like the Padres, Browns, Chiefs, and Dolphins work with us to take an innovative partnership approach with corporate sponsors to provide valid measures of sponsorship returns.

Why (not) work with academics?

WCAI Partners
WCAI Partners

ESPN and the Sports Analytics Conference partner with MIT. Wharton’s Consumer Analytics Initiative (WCAI) works with a variety of corporate partners (see right) and also works with sports teams. Yet, some corporate and sports organizations are hesitant to engage with academics.

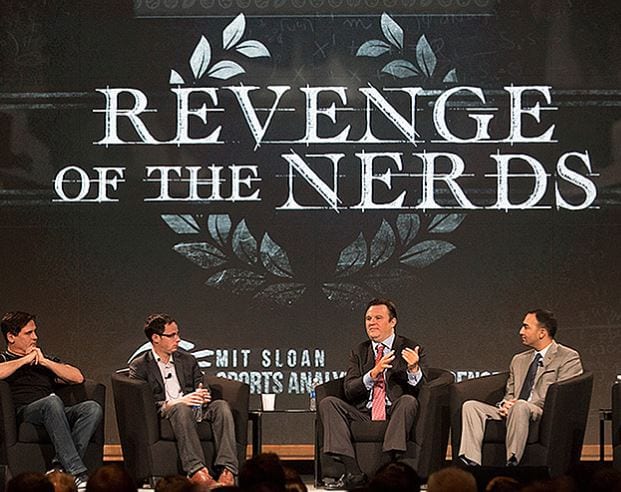
Hey, I get it, we’re a little weird. Some of us are a lot weird. There’s a reason the Sloan Sports Analytics Conference is called a “nerdfest” and hosts a panel entitled, “Revenge of the Nerds.” But, for the fearful, here are three reasons you should work with academics:

  1. Focus. At research institutions like MIT, Wharton, and Baylor, faculty are experts in very specific fields. Aside from service responsibilities, typical workload is 50% research & 50% teaching. We spend 2-4 days a week, about 50 weeks a year, often for many years focused on finding out what’s new in one or two areas–which leads to the next point.
  2. Innovation. Academics are rewarded for publishing research. Research gets published (ideally) only when we learn something new. In contrast, syndicated research firms are rewarded for standardizing and commercializing past practices.
  3. Confidentiality. If you read the Sports Business Journal and popular press, you might think academics will want to publish the name of the team, the executives, and specific financial or customer data. In sharp contrast, academics do the opposite for two big reasons:
    1. Research is published when it’s generalizable to other situations. Sports is just the laboratory to study interesting phenomenon. We often don’t state the specific team or location because then someone would say it might not apply elsewhere.
    2. Research is based on the relationship between variables or fields in a data set–not the levels. In other words, we care about the relationship between X and Y, not the levels of X and Y. So, if you had data on fan demos and expenditures, we don’t care about the amounts–we care about how much variable X (e.g., tickets used) influences variable Y (e.g., renewals). What we report is the strength of relationships.
  4. Expense. What academics need most is data. If you can provide access to data, most academics will trade time for cool data. Obviously, our institutions and programs need support so we can conduct research and teach the future business leaders of the world. Partners understand that (e.g., WCAI, above), of course. But, essentially, all we need is access.

And we thank you for your support.

7 Ways to Make Sponsorships Fit

7 Ways to Make Sponsorships Fit
by Kevin Gwinner – July 2014

You probably rely on a variety of benefits when pitching a sponsorship opportunity to a prospect, including things like signage options, hospitality opportunities, media exposure, and activation potential. However, have you considered the value of how well your brand “fits” with the prospective partner?

What does research tell us?

Research we’ve done shows that a good match between the sponsoring brand and property leads to a number of positive outcomes. More specifically, a strong sponsor-property fit results in:

  1. Positive attitudes and emotions toward the sponsor and the sponsorship
  2. Higher recall of the sponsoring brand
  3. Higher levels of attention to the sponsor
  4. A greater willingness to consider the sponsor’s products.

These successes lead to higher sponsorship renewal rates, and it’s a great selling point for a brand to choose your property over others.

When is the fit obvious?

The term “elephant test” is sometimes used to describe situations in which an idea or object is hard to describe, but instantly recognizable when viewed. Fit between sponsor and property can often be considered an idea where the elephant test is in play. Audiences will often have a feel for whether a sponsor and property fit together, even if they have difficulty defining why.

The “why,” however, is typically based on at least one seven common types of fit:

  1. Use — when sports participants or audience members are likely to use the sponsoring brand
  2. Size similarity– when the brand and property are equally prominent
  3. Audience similarity– when the brand and the event share the same target audience
  4. Geographic similarity — when the brand and property have the same scope of influence
  5. Attitude similarity– when there is equal liking of the brand and property
  6. Image similarity — when both brand and property have equivalent meaning or image in consumers’ minds
  7. Time duration — when the brand and property go together because of historic ties

Which type is best?

Should brands and properties seek partnerships with particular type of fit? Are multiple fits better than a single fit?

This seemingly simple question has a complex answer, because the best fit depends on many factors. The interplay between the fit type and the product category may influence which type is the best. Product categories differ in purchase frequency (soft drinks vs. automobiles), purchase involvement (candy vs. vacations) and consumer interest (casinos vs. insurance). So, for example with casinos, geography and size (prominence) might be more important than anything else.

How “the best” is defined will influence the answer of which fit is best. In some instances “best” might be measured by the pairing that results in the highest level of recall. But, of course, there are many other measures of “best” depending upon the goals of the sponsoring brand. These could include changes in brand attitude, purchase intentions, word-of-mouth propensity, and image change. Thus, what is deemed to be the best is dependent upon what goals the firm is seeking to achieve through sponsorship.

What if the fit isn’t obvious?

Is all lost if no obvious fit exists? Sponsorship research indicates “articulation” holds value if the partners communicate why the firm sponsors a particular event, especially if a fit argument can be made (e.g., Brand X is proud to sponsor team Y because of….). This explanation tends to have a more favorable effect when the communication about the sponsorship originates from the property rather than from the sponsoring firm.

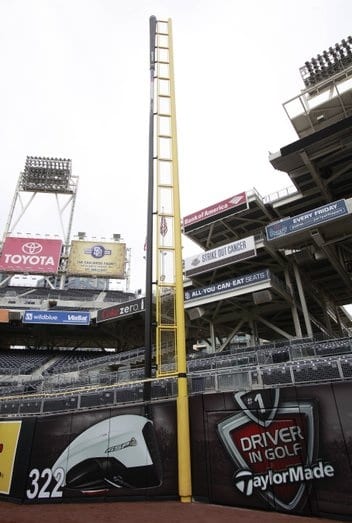
Other creative approaches can manufacture fit. Southwest Airlines sponsors the NBA halftime break, which somewhat fits with its “Wanna Get Away” campaign. Better fits were the Nestle’s sponsorship of the NBA Crunch Time Stat of the Game and the Dutch Boy Paint’s “In the Paint” TV segments. The San Diego Padres made a TaylorMade club fit as a right field foul pole. The Chicago White Sox start games at 7:11 because, you guessed it, an anchor sponsor is 7-11.*

In the end, it’s up to you to assess sponsors for the appropriate fit or to get creative to make the sponsor fit. Because if it doesn’t “fit” in the buyers’ minds, you won’t be looking at a good fit at the end of the contract.


*The foul pole and the 7:11 ideas are originals from Dan Migala. Contact Dan at the Property Consulting Group.


Top 5 Things We Learned About Compensation, Salespeople and Their Managers

Top 5 Things We Learned About Compensation, Salespeople and Their Managers
by Kirk Wakefield – May 2014

The State of the Sports Sales Industry Survey

With your help responding to the S3 Sales Report survey in December (N = 328) and the help of the NBA & Murray Cohn in surveying inside sales and account reps in the NBA and WNBA (N = 391), we gained a better understanding of the relationship between salespeople, their managers, and their performance. Here are the top 5 things we learned, along with average salaries at various ticket sales positions.

#1 Show us a team with a bad ethical culture and we’ll show you some unhappy salespeople.

In the sales culture, and maybe just culture in general, so much is about “show me the money.” But, guess what? The numbers don’t lie when it comes to job satisfaction. The ethical climate has at least twice as much influence on a salesperson’s job satisfaction compared to how much the sales rep earns on an annual basis. There is a correlation between compensation and job satisfaction; it’s just that money doesn’t tell us as much as knowing the culture of the sales organization.

#2 Sales professionals in sports are pretty smart.

If obtaining a bachelors or masters degree is any indicator of intellectual capabilities, then it looks like we’re a pretty smart bunch. In the U.S., only 36.6% have college degrees and another 11.6% have masters. What about salespeople in sports?

Over 81% of the S3 Report respondents, and more than 86% of NBA/WNBA salespeople, have college degrees. Among S3 Report respondents, another 15% have graduate degrees, along with 8% of NBA salespeople with advanced degrees. Together, we can say that about 95% of the sales force in sports are staying in school to graduate before making the jump to the pros.

#3  Winning isn’t everything. In fact, maybe not anything.

When it comes to what really determines who makes the most money, it’s not whether or not you’re selling the hot team. It’s not even market size. In fact, looking at the NBA data across all teams, the team’s won/loss record and the size of the team’s market together determine less than 20% (i.e., 19.6%) of salespeople’s total compensation. That means 80% of a rep’s compensation is determined by the organization and the individual.

  • The amount of commission one can make is influenced a bit more by market size & won/loss record (26.3%). But, that still means about 3/4ths of commissions earned is up to the team and reps.
  • Interesting fact: Because W/L record is correlated with market size, the team’s record has very little effect on compensation once we account for market size.

#4 The only selling time that correlates with greater commissions is face-to-face.

We measured what proportion of selling time NBA  reps spent on the phone (65%), email (21.5%), chat/text (3%), social media (1.4%), and face-to-face (8.6%). The only activity that significantly increases commissions is face-to-face. Of course, we can argue that the other activities lead to appointments; but, the point is that personal contact is king.

#5 Once established, compensation in sports sales is competitive.

The current practice of hiring into inside sales to smile & dial as a proving ground may be shifting as more teams move toward more effective and efficient selling with sales analytics and CRM-based messaging and marketing strategies.  But, in the mean time, we can see teams are able to attract able bodied candidates with compensation levels markedly below starting salaries of sales & marketing graduates working in other industries ($51,900). That said, once promoted to an AE position, prospects begin looking up.

The data below is based on data from salespeople and managers primarily representing MLB, NHL & NFL teams, supplemented by the data from entry-level sales reps of 25 NBA teams. We did not receive enough information from collegiate sports sales reps to represent that growing market of potential sales jobs.


Average Compensation for Sales Positions in Professional Sports
Average Compensation for Sales Positions in Professional Sports (December 2013)


Wait ’til next year!

Thanks again to Murray Cohn and the NBA in collaborating on this study. We also thank our friends across the leagues who independently responded to our first annual state of the sales industry survey. In our next round (December 2014), we would like to gain more involvement at the league level and collegiate level so that we could reliably represent average salaries across each league and level, as well as dig deeper into what motivates and accelerates salespeople’s performance.


Cover photo courtesy of  Barry Yanowitz.


How can properties support sponsorship rate cards?

How can properties support sponsorship rate cards?
by Kirk Wakefield – January 2014

Is sponsorship more about media or meaning?

Why should brands pay for the rights to be an anchor sponsor of an NFL, MLB, or NASCAR property? Can these properties defend their rate cards that afford brands the rights to communicate with their fans via the property’s venue, television, radio, website, social media, special events, and logos/marks?

anne rivers“We have been very successful showing the success of sponsorship to build brand equity, and in turn firm value, which has been harder for those trying to use impressions to capture ROI.” ~Anne Rivers, SVP, Global Director of Brand Strategy, BAV Consulting

Sponsorships activate the brand in the minds of passionate fans across multiple channels to achieve brand objectives. If it were just about buying media and exposures to gain a particular audience, there are typically cheaper (CPM) options than sponsorships. But, exposures can be important, because it gives some idea about the potential to reach passionate fans. What it doesn’t tell us is if they are paying attention.

So, the question becomes less about media and more about meaning.

Brand managers are smart. They know single exposures (or even a few) of a brand message have no meaningful impact on consumers. They know people pay more attention when they are highly engaged and passionate, which is what people are about their favorite sports, teams, and players. They also know consumers think, feel, and act more positively toward a brand if the message is received and reinforced through multiple channels.

This brings us to the sponsorship question of the day: Is paying the property for the rights to use their assets worth it?

Evidence for rate card support

[dropshadowbox align=”right” effect=”lifted-both” width=”350px” height=”” background_color=”#ffffff” border_width=”1″ border_color=”#dddddd” ]
matt webb“Brands have had an overwhelmingly positive response to our analytical approach to measurement. Our ability to provide our partners with measurable, goal-oriented results is invaluable and allows us to truly be a solutions provider.” ~ Matt Webb, Director, Corporate Partnerships, Cleveland Browns[/dropshadowbox]After years working with brands such as AT&T, TXU Energy, HEB, and a variety of other brands in cooperation with The Marketing Arm, this past year I began working with clients in NASCAR, MLB, and the NFL to determine if anchor sponsors receive more bang for the buck than mid or lower level sponsors.

We learned two simple lessons that we’ll complicate with colored charts and graphs.

#1 Attendance means nothing. Engagement means everything.

Fans can spend up to 36 hours over three days at a NASCAR racing event. And many do.  But the number of hours at the track has no significant correlation with whether or not fans recognize the activation of brands like Ford, Coke, Sprint, and SpeedTV. Instead, it’s the frequency of engagement with sponsors–which we measured using RFID tags connecting fans with sponsor activation locations–that predicts whether or not fans distinguish the brand as a sponsor and not its competitors.

bav#2 More channels increase relative brand equity.

With our partner, BAV Consulting, we measure a brand’s energized differentiation (see inset) for not only the sponsor, but also competing brands who may be sponsors or ambushers. In short, sponsors routinely outperform non-sponsors (see our MIT Sports Analytics paper). But, what about anchor sponsors versus secondary sponsorships?

Working with our NFL and MLB team partners, we compare multiple categories of anchor versus secondary sponsors in terms of fans’ recognition of the sponsors’ use of property assets: stadium signage, stadium messages, special game promotions, website, social media, television, radio, and use of team marks in advertising/POP.

If you’re the kind of stats nerd that attends and understands the data analytics presentations at the MIT or Wharton conferences where we’ve presented, then the charts below are for you. If not, here it is in words:

  1. Activation not exposures. How often the fan attends, watches or listens to games increases the odds of recognizing the brand’s sponsorship activation (the green boxes), but does not have a direct effect on the brand’s energized differentiation (the red boxes). This reinforces our NASCAR findings: Just being there doesn’t count. The brand must be activated in the minds of the fans.

    meaning not media
    Table 1
  2. Multi-channel communication. The greater the multi-channel activation among the property’ eight assets, the greater the energized brand differentiation of the sponsor (dark green boxes).
  3. Anchors = activation. Fans recognize anchor sponsor communications across more channels than they do for mid-level or low-level sponsors in the same categories (tan boxes). In other words, the additional assets pay off with greater activation of the brand among fans.
  4. Brand equity effects. For the eight categories we tested, each additional effective channel increases energized brand differentiation by 6-7% (the regression equation in Table 2 is an example of one anchor sponsor for the NFL team). Overall, the number of effective channels explains over 90% of a brand’s asset value in the minds of fans. This is a big number.

    Table 2
    Table 2

Conclusion

Some might still say, “So, what? Where’s the big payoff?” We’re glad you asked.

Consistent with our findings in each category, the chart below shows what happens to market share among those fans who recognize activation across multiple channels between the anchor sponsor and the low-level sponsor in the same category.

Both sponsors are national brands with otherwise strong brand equity according to BAV Consulting. But, the payoff for being the anchor sponsor for the NFL team brings substantive market share increases (4.4% ) for each additional effective channel.

If your team or brand would like to learn more, please tweet (@kirkwakefield) below or email. Happy to help!

market share