Are Silicon Valley Teams as Data-Driven as You’d Expect?

Are Silicon Valley Teams as Data-Driven as You’d Expect?
by Brad Sherrill – October 2017

With Apple’s headquarters right down the street, you would expect the teams in Silicon Valley to be digitally-savvy and data-driven. We were not disappointed, as the teams from San Jose demonstrated how they employ business intelligence to generate revenue.

Sharks Leadership Analytics-Driven

Flavil Hampsten, Executive Vice President & Chief Marketing Officer, began honing his sales & marketing analytic skills to drive revenue while completing his MBA at Arizona State in 2009 and serving as Vice President of Ticket Sales at the Phoenix Coyotes, before heading to the Charlotte Hornets and now back in the NHL at the Sharks. Neda Tabatabaie was brought in at the Sharks to implement a cohesive data strategy when Mr. Hampsten arrived in 2015.

CRM Boosts Sales

S3 graduate McKenzie Bryan said, “I really enjoyed hearing from the Sharks on how well they integrate CRM/Analytics into the sales department and all of the ways a solid CRM system helps sales.” The Sharks organization encourages utilization of CRM to achieve more efficient and effective sales numbers. Beyond this, however, the Sharks want salespeople to be analytical and intentional as they attempt to make connections with current and future fans.

[slideshow_deploy id=’10035′]

49ers Commit Headcount to Analytics

Hayley Di Naso, Hospitality Sales Executive (S3 ’15), hosted us at the 49ers. Following a stadium tour, Demar Amacker and Paul Epstein explained the organizational structure and integral nature of CRM as strategy working hand-in-hand with sales. The Business Strategy & Analytics group, led by Moon Javaid, includes five staff members with analytics responsibilities.

S3 Senior Jacob Kurian appreciated how “every aspect of the experience at Levi’s Stadium has been thoroughly planned out.” The 49ers have created an authentic atmosphere in the stadium that reflects much of what people in the area value. Levi’s Stadium uses repurposed redwood finishing in its concourses and has 16 (Joe Montana’s number) native plant species growing on the patio atop the building. The stadium also showcases an impressive collection of local artwork.

[slideshow_deploy id=’10028′]

Next up

We completed the S3 StubHub Analytics All-Stars trip with visits with the Warriors and Giants. Stay tuned for our next report!

How far will analytics take You? S3 majors meet with partners at StubHub, Giants, 49ers, Sharks, & Warriors to Find Out

How far will analytics take You? S3 majors meet with partners at StubHub, Giants, 49ers, Sharks, & Warriors to Find Out
by Brad Sherrill – September 2017

StubHub and Baylor S3

StubHub and Baylor S3 created a partnership to reward motivated, analytically-talented S3 students with an expenses paid trip to the Bay area. The inaugural S3 StubHub Analytics All-Stars group visited San Francisco for three days, gaining valuable interaction time with representatives from some of the Bay’s sports industry leaders. Thanks to StubHub’s generosity, we spent three days visiting with executives from StubHub, Golden State WarriorsSan Francisco 49ersSan Jose Sharks, and San Francisco Giants.

S3 Senior Ian Young said, “It was great to see the variety of career paths people have taken to get to where they are in the sports industry. I really got a feel of how closely connected people are in the sports industry and how best practices are shared among teams.” Young also commented on the value of being data-driven as an organization. Each organization relies on a data strategy to generate revenue utilizing analytics, CRM, and BI/BA to derive actionable insights.

[slideshow_deploy id=’9986′]

The StubHub Data-Driven Culture

Our group began the circuit of Bay area sports and entertainment properties by visiting StubHub’s corporate offices. Located in downtown San Francisco, the office encapsulates much of the Silicon Valley atmosphere and emphasis on creating a comfortable, enjoyable work environment.

S3 students received a tour of the office followed by interactive panel discussions with six StubHub employees whose positions touched many of the company’s various focuses. S3 Senior Jonathan Roselli found value in “understanding how analytics are used to report, optimize and predict performance.”

Adam Budelli headed the panels that included Charlie RockmanRaymond DelacruzMena AlsrogyRyan McDowell, and Adam Tatum. These professionals work in areas covering partnerships, business development, data management, analytics, consumer insights, data science, business operations, and marketplace supply chain analysis.

Join us!

If you are interested in the Sports Sponsorship & Sales (S3) program at Baylor, visit www.baylor.edu/business/s3. Prospective students and transfers can find out more about their tickets to a career in sports. Like StubHub and other S3 Leadership partners, organizations can learn about supporting the growth of talent for the industry by visiting www.baylor.edu/business/s3/board.  Look for more stories with insights from executives we met at the Warriors, 49ers, Sharks, and Giants in the coming weeks.

Since launching the first Sports CRM & Analytics track in the U.S in 2011, the S3 program is the leader in placing graduates in data analytics roles at teams [Dallas Cowboys, Dallas Mavericks, Dallas Stars, Houston Astros, Houston Dynamo, Houston Texans, San Antonio Spurs, Madison Square Garden, New York Yankees, Denver Nuggets, Columbus Blue Jackets, Orlando Magic, Miami Dolphins, , Utah Jazz, University of Southern California] and sports-related companies [KORE Software, Stone Timber River, Eventellect, E-15 Group, The Company, Legends Hospitality, and SportsDesk Media]. 

How to Sell Tickets to People Who Won’t Answer the Phone

How to Sell Tickets to People Who Won’t Answer the Phone
*This post was written by Kirk Wakefield – June 2017

Do you answer a call from an unknown number? Neither does anyone else.

Americans spend upwards of 4 hours a day on smartphones, but odds of answering an unidentified caller are about one in four. Millennials are even less likely to answer: Phone calls are seen as intrusive, impersonal, presumptive, time-consuming, and annoying.

According to Nielsen, Millennials spend more time on mobile devices than on TV. So, how do we reach them? We find them where they are and sell the way they like to buy.

Geo-Targeting: Raiders Case Study

Where people come from influences how they buy–and how much they’ll pay and when. Working with our partners at StubHub, we find out-of-town fans are willing to pay significantly more, even as game time approaches. Below we see the difference in ticket prices paid for Raiders games in 2016, which is similar to other markets with respect to time and distance. Using geo-targeting, we can target campaigns (e.g., Google AdWords; emails) based on location.


Single-game buyers and, increasingly, multiple-game buyers prefer choosing individual games (vs. ticket plans) when they want to buy and when they want to go. Young consumers have always been variety-seekers. But, Nielsen reports all buyers are increasingly focusing on a wider variety of entertainment options than in the past. Buyers aren’t just thinking about your team (i.e., the Raiders). They may just as easily click on the next Groupon, social media offer, or Yelp recommendation.

Today’s ticket buyer is twice as likely to visit ticket websites (primary & secondary sources) than to directly contact the team. Younger buyers expect frictionless[ref]Read more about frictionless service here.[/ref] experiences. That’s why teams optimize for mobile sales and distribute tickets on secondary markets to take advantage of buyers where they are and how they want to buy.

What do buyers really want?

You need to know how seats are moving in the open market to appropriately set season ticket and individual game prices to maximize revenue.

Ticket distributors (e.g., Eventellect) and sellers (e.g., StubHub) help teams understand the dynamic nature of markets by analyzing what inventory sells through and at what prices. Sample data for an NCAA property (left) illustrates a typical pattern of average ticket prices (ATP) by seating area and the percentage of those tickets which sold (STR: Sell Thru Rate).

Buyers are less price sensitive for sports & entertainment events than for pretty much anything else. [ref]Wakefield & Inman (2003), “Situational price sensitivity: The role of consumption occasion, social context and income,” Journal of Retailing, Vol 79(4), 2003, 199-212.[/ref] Here, the highest priced premium seats ($900+) and the Field Club ($250) seats sell through well (75-80%). The lower STR (67%) for Stadium Club seats suggests needed adjustments to improve perceived value compared to the more or less expensive seats nearby. The high STR on New Alumni seats suggests the team could raise those prices, but may have overshot the mark on the Gold Zone seats. Without this data, this team would continue to leave money on the table or empty seats with inefficient pricing schedules.

The right side of the charts above show the hottest seat sections on the market for this team. If they offer inventory using dynamic pricing, share revenue with a consolidator, or (opaquely) distribute via a ticket provider like StubHub, they will capitalize on the high demand for specific sections (e.g., Benchback I and Gold Zones W and CC).

When should we release inventory and adjust prices?

Most individual game tickets sell during the week prior to the event. Well over a third sell in the last 72 hours. As the sample data shows below, advance ticket buyers are willing to pay more (ATP = $128) compared to those buying in the month leading up to the event (ATP = $72).

When should tickets be released for individual purchase? Earlier is better. Some teams hold tickets back to release close to game time. But, we can see this is not the best time to get the highest price. In a forthcoming journal article, we find that experienced sports & entertainment buyers have learned it’s better to wait to buy. But, if you want to sell high–like to out-of-town visitors and other infrequent, inexperienced buyers, supply needs to increase well in advance.

Conclusion

We’ve been analyzing retail pricing strategies for over 25 years. Pricing strategies in sports are quickly catching up with corporate practices, but much less is known about pricing intangible services than pricing tangible goods and products.

If you’d like to learn more about opportunities to analyze your ticket data or gain more insights, feel free to reach out to our friends at StubHub: Charlie Rockman, Nick Rudolph, and Adam Budelli. If your organization is interested in collaborating in our research center, please contact Kirk Wakefield.


StubHub Ticket Insights: Changes in Who, How & When People Buy

StubHub Ticket Insights: Changes in Who, How & When People Buy
by Kirk Wakefield – May 2017

In a league of its own

StubHub sells a ticket at least once every second. Over 21 million unique highly qualified buyers visit StubHub every month. Last year (2016), StubHub sold over $4.2 billion in tickets. That total essentially places StubHub in a league by itself, comparable to the NBA or Premiere League and more than the total revenues of the NHL, Bundesliga or La Liga.

Thanks to our S3 partnership with StubHub and Geoff Lester, our friends Charlie Rockman and Nick Rudolf presented breaking insights at our annual S3 Board Meeting in January, 2017.

In this article we present three of these insights related to demographics, search habits and mobile use in ticket purchase. Next month we will follow with insights on geo-targeting, conversion to ticket plan buyers, and inventory management given the timing of purchase behavior.

Demographics of online ticket buyers

Knowing half the females in the DFW metroplex are Dallas Cowboys fans, the Cowboys launched www.5pointsblue.com to offer content written by female staff members. The content appeals to the female fan base, but a broader audience as well, generating 350,000+ monthly visits. Other properties would do well to emulate the initiative to serve its entire fan base in a way that meets needs and preferences.

As seen below, we see a slight shift in females buying online (43%), but more importantly the Average Order Value (AOV) increased among first time female buyers versus first time male buyers. As millennials overtook baby boomers as the largest generation this past year, so has the percentage of younger buyers. These young buyers may see concerts and other events as viable entertainment options to sports. Commensurately, we see more lower-income first-time buyers–who will be tomorrow’s potential season ticket holders. The question is: How are teams serving the buying needs of this younger segment that will translate into future ticket buying fans?


Ticket Search: Event, Team or Date?

Knowing how people search is one of the keys to successful Google AdWords campaigns. Which of these is most likely to show up in a relevant search?

  • Event (Cavs vs. Rockets)
  • Team (e.g., Cleveland Cavaliers) or artist (Justin Timberlake)
  • Date (Friday, December 1, 2017)

We might think new buyers typically want to see a specific event on a certain date. We would be wrong. Instead, buyers increasingly and foremost search for the team or artist, rather than having a specific event or date in mind. Furthermore, last minute purchases (33%) and on-the-go (not at home/office) are the major reasons for purchasing via mobile. So, if we want to reach people where they are–with phones in hand–we best be mobile and search-engine optimized for quick access.


Mobile First Strategy

In 2014, 41% of traffic and 20% of sales came via mobile for StubHub. Just two years later, 60% of traffic and 42% of sales came via mobile. In general, revenue from 2015 to 2016 is increasing via online purchases, but disproportionately via mobile in terms of tickets sold (+25%) and total sales (+44%) compared to tickets sold via desktop (-3%) and total sales (+10%). (See graphic at the top of this article.)

Expect the trend toward mobile to continue. In the past the majority of time spent on mobile was searching, but most purchases of goods and services were made on desktops. But, as StubHub and others with native apps improve the mobile experience, more will shift to mobile purchases.  As seen below, the majority of purchases are still on desktops, but more bought via mobile devices and native apps in 2016 than 2015. The most mobile-friendly buyers are football (NCAA & NFL) fans, but the growth in mobile purchases will extend across leagues.


Conclusion

In short, the takeaway insights are:

  1. Target females the way they consume content and make purchases.
  2. Manage search engine campaigns aimed at team/artist searches, more so than event or date.
  3. Optimize for mobile ticket purchases. If your mobile sales are not growing at the same rate as the market, you are not mobile optimized.

When do people buy? And what happens to average ticket price over time? We know over one-third now wait until the last 72 hours to purchase. To learn more, come back for next month’s release.

Sport Business Analytics: A Review of Harrison & Bukstein’s Book

Sport Business Analytics: A Review of Harrison & Bukstein’s Book
by Kirk Wakefield – January 2017

Business intelligence is old school. Business analytics is new school. Sport business analytics is finally going to school. In the past decade, interest grew beyond the 100 or so nerds at the first MIT Sports Analytics Conference to  sellout crowds (>3000 geeks and wannabes) today. At the same time, courses and programs have emerged to educate tomorrow’s sports business analysts.

To that end, C. Keith Harrison and Scott Bukstein, of the University of Central Florida, compiled a collection of 13 chapters (plus a chapter on teaching a related class) from professionals and academics for their edited book released by Taylor & Francis, entitled, “Sport Business Analytics: Using Data to Increase Revenue and Improve Operational Efficiency.”

In all fairness, I acknowledge a number of the chapter authors are associates. My intent, then, in this book review is to not treat them as I do my friends, but will instead try to be considerate and complimentary.

The Evolution & Impact of Business Analytics in Sport

The question, “What is analytics? Really?” is often raised among academics. Professors and data scientists tend to think of analytics as using advanced statistical techniques to model and predict behaviors based on (big) data. Practitioners may refer to analytics when they really mean reporting.

In the opening chapter overview of the text, Scott Bukstein states the core purpose of sport business analytics is “to convert raw data into meaningful, value-added and actionable information that enables sport business professionals to make strategic business decisions, which then result in improved company financial performance and a measurable and sustainable competitive advantage.”  In short, analytics is any “data-driven process as well as any actionable insights derived from data.”

Consistent with this understanding, the book chapters provide good case examples of data-driven processes that produce actionable insights. In large part, many of the chapters read as a series of case studies with examples of how organizations implement analytics. The chapters provide instruction to understand what leading teams and companies do on a day-to-day basis, as well as propose thought-provoking ideas for practitioners.

Ticketing Innovation

In Chapter 2, Jay Riola offers replicable examples of how the Orlando Magic use customer data to target and engage fan segments through appropriate digital channels and devices. Other teams would do well to learn from the success of the Magic’s Fast Break Pass and season ticket holder app, as thoroughly explained by Jay in this chapter.

Using ticket pricing analytics, Troy Kirby does a great job explaining how the secondary market is the primary market, in Chapter 3. Troy makes the argument that a ticket may eventually evolve beyond its current revocable license legal status to a material good, allowing greater freedom for fans to use and resell however they wish. The practical upshot of these two chapters is teams must more quickly adapt to digital channels–whether owned by the team or others–to provide value to fans. Teams with NIH attitudes will suffer.

Data Management & Marketing

Ray Mathew offers a basic understanding of how teams use CRM to gather and analyze customer data for use in targeted marketing campaigns in Chapter 4. Since CRM coordinators are typical entry-level positions, interested learners should be motivated to self-learn, intern, or take courses in CRM to prepare for careers in data management in sports. This chapter provides a good foundation for students to understand if this is a viable career path for them.

Michael Farris provides an overview of the Aspire Group’s 8-point ticket marketing, sales and service philosophy in Chapter 5. Academic programs lacking courses in marketing strategy will benefit from the Aspire Group’s marriage of marketing with analytics. Programs housed in business schools will also appreciate founder Bernie Mullin‘s sound approach to management and marketing. The application of the model to the experiences of Georgia Tech are particularly insightful for NCAA programs. Plus, students in classes adopting this text will go into interviews with Aspire knowing what they’re all about!

Research & Applications

Chapter 6 leans closer to the professor or data scientist’s POV of business analytics. Michael Lewis, Manish Tripathi and Michael Byman address the importance of calculating, tracking, and managing customer lifetime value (CLT) and related functions of brand and fan equity. CLV is critical to model retention and seat-buying decisions. The authors present insights into NFL team’s fan equity and social media equity to pinpoint pricing and promotion opportunities. Updates among leagues are available on Michael Lewis’ blog at Emory University (follow link here).

John Breedlove illustrates how teams use analytics to improve the performance of sales reps with targeted campaigns to open the door to warm leads. In this chapter (7), John illustrates the importance of keeping analytics simple to increase efficiency and effectiveness. Combining public (secondary) and private (primary) data can provide insights to make decisions, as when the Tampa Bay Buccaneers used public geodemographic information to help set prices and target customer segments. This chapter provides a good explanation and case study for A/B testing.

Digital Media Analytics

Duke University serves its huge fan base through its crowdsourced data visualization platform know as #DukeMBBStats. Ryan Craig provides an engaging explanation of the process Duke followed to grow the platform. Ryan’s chapter (8) offers direction for other NCAA and pro organizations to create fan profiles to authentically and personally engage fans with effective marketing strategies to enhance renewals.

Michael Lorenc and Alexandra Gonzalez present a fascinating chapter (9) on leveraging digital marketing to drive revenue, relying on data from their employer (Google) to paint a picture of today’s digital buyer. Evidence shows the potential ROI on digital marketing informed by audience, acquisition, and behavioral and conversions data via Google Analytics. You’ll be analyzing your own website and digital marketing before you finish the chapter.

Sponsorship Valuation & Affinity Groups

 Adam Grossman and Irving Rein provide one of the best summaries I’ve read on the state-of-the art in sponsorship valuation. [dropshadowbox align=”right” effect=”lifted-both” width=”200px” height=”” background_color=”#ffffff” border_width=”1″ border_color=”#dddddd” ]”Where audience analysis often fails is the inability to recognize that it is never static.” ~Grossman & Rein[/dropshadowbox] The authors provide descriptions of inherent valuation (profits generated by sponsorship assets), relative valuation (comparing CPMs across channels), and comparable valuation (comparing the price of assets offered by different properties), as well as how best to communicate to particular audiences. In addition to teaching at Northwestern (along with Professor Rein), Adam founded Block Six Analytics, using analytics and technology to help brands and teams generate revenue.

Co-editor C. Keith Harrison of the text, along with Suzanne Malia Lawrence, introduce the concept of “live analytics” in Chapter 11 to study and understand affinity groups and develop marketing plans accordingly. Live analytics, in this case, means distributing surveys during events, collecting and analyzing the results, and then creating innovative ways to engage fans. They provide an example of the Gridiron Girls football clinic at Montana State University. Another good example at the pro level is the Dallas Cowboys 5-Points Blue designed for female fans, based on extensive primary research and analysis of other NFL teams to differentiate the affinity group.

5 Points Blue

Talent Analytics & Data-Driven Storytelling

Brandon Moyer explains how the Aspire Group and others use analytics to hire and develop talent in the business of sports.  At Aspire, they look for employees with WHOPPPP:

  1. Work ethic
  2. Honesty, integrity & character
  3. Openness to learning
  4. Passion for sport business & sales
  5. Production (results)
  6. Positive attitude
  7. Potential for leadership

This chapter (12) provides other examples of how teams and companies (should) use data-driven approaches to hire and evaluate personnel.

Ryan Sleeper illustrates a variety of data visualization approaches to enhance storytelling–or communication–with the intended audience in Chapter 13. Effective visualization reduces time to insight, increases accuracy and improves engagement. The lesson here, again, is: Keep it simple. Ryan offers engaging examples of how to hook an audience–like converting a league standings table into a map to quickly gauge relative team performance. See more of his Tableau tips at his website. While we are at it, we strongly recommend taking a course in Tableau if your goal is to succeed in the business of sports.

Conclusion

Michael Mondello provides a concluding chapter on how to teach a sports business analytics course. Dr. Mondello provides helpful examples of his approach to class relative to content delivery, class assignments,  and exams.

The approach in the Sport Sponsorship & Sales (S3) program is to combine the Sport Business Analytics text (most Mondays) followed by lab instruction (most Wednesdays) using Microsoft Dynamics 365 to learn CRM and marketing automation processes reliant upon analytics. Microsoft IT Imagine Academy provides video instruction for learners at member Microsoft Dynamics Academic Alliance schools. Code Academy offers free courses on related data management topics, such as SQL.

To assist others using the text, below is a list of key terms for each chapter. To give the reader of this review an idea of the concepts and content, the first and last chapter are complete with definitions. The first chapter outline also provides tips on studying, just in case some students are still trying to figure that out. Other chapters contain key terms/concepts only. Feel free to download, edit and use for your own class purposes.


Chapter: Topic
Chapter 1 Evolution and Impact of Business Analytics in Sport
Chapter 2 Analytics and Ticketing Innovations at the Orlando Magic
Chapter 3 Ticket Markets in Sport
Chapter 4 CRM & Fan Engagement Analytics
Chapter 5 Ticket Marketing Sales and Service Philosophy
Chapter 6 Empirical Research Methods
Chapter 7 Data Driven Marketing Initiatives
Chapter 8 Fan Engagement Social Media Digital Marketing Analytics Duke
Chapter 9 Leveraging Digital Marketing to Engage Consumers and Drive Revenue
Chapter 10 Communicating the Value of Sports Sponsorships
Chapter 11 Market Research Analytics
Chapter 12 Talent Analytics
Chapter 13 Visualization is the Key to Understanding Data


The Online Ticket Buyer: By the Numbers

The Online Ticket Buyer: By the Numbers
by Kirk Wakefield -October 2016

Nationwide Study of Recent Online Ticket Buyers

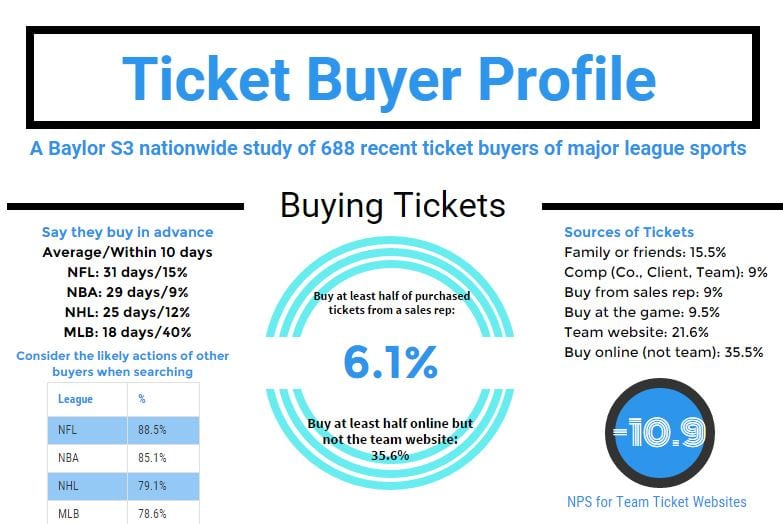
Efficient and effective salespeople convert ticket buyers into season ticket holders and serve their needs. However, the secondary market is the primary market for many fans who do not differentiate between buying from StubHub, TicketMaster or the team’s website. What do these buyers look like? How do they buy? Where do they buy? What is important to them?

The Online Ticket Buyer Profile infographic offers an overview of our initial findings from a wide-ranging study of 688 recent online ticket buyers of tickets. Given the time of year and panel source, we draw primarily from NFL, MLB, and NBA ticket buyers, but also have representation from NHL and a few MLS buyers. All bought tickets within the past 12 months.

We will present more in-depth results and insights at the Baylor S3 Annual Board meeting, January 17-18, 2017. Students will present analysis & insights to the industry on December 5, 1-4pm. Guest judges are welcomed.


6 Creative Tips to Build Fan Loyalty

6 Creative Tips to Build Fan Loyalty
by Jeff Tanner – July 2015

Loyalty programs have been around now for thirty years. The first were travel programs, created initially by Hal Brierly for companies like American Airlines and Hilton. After three decades, we’ve learned a few things about what works and what doesn’t. One of the things we’ve learned: You don’t need a loyalty program to build loyalty – or rather, you don’t need a frequency program.

Most programs are built on some measure of frequency. Our local Starbucks had a punch card long before Starbucks official reward program: If you bought 10, you got the next one free. The loyalty program simply took that concept to the next level – and often to the Silver, Gold, and Platinum levels. But this type of program requires tracking systems that can be expensive.  Even if you can’t afford a fancy tracking system, there are things you can do to reap the benefits of loyalty.

What you do need?

Some questions to ask yourself first.

What type of loyalty do I want? Do I want people to like us more or engage in some specific behavior? While these may seem obvious, the answers are important. Too many organizations want better sales but then create programs that reward the wrong behavior. For example, JC Penney created a very loyal base of customers who loved the company but were trained to wait for the sales. Exclusive access to merchandise for your most loyal fans, for example, doesn’t mean you put it on sale. If you always give your most loyal fans bigger merchandise discounts, then they’ll love you right out of business.

What is the current state of fan loyalty? In some instances, fans may love a team but love to watch it on TV. Or they only come to premium games – great for the broadcast sponsors but not so great for the team. Loyalty programs are not free. By setting specific goals, the question becomes not does it work, but what works?

What do you do?

Now that you know what you want and where you are – what do you do?

Randomize (Some) Rewards. One benefit of a tiered system is the observed increased frequency of purchases as customers get near the next level. But, we’ve also seen increases in purchases following a random reward.  Panera and Sonic both use randomized rewards, such as a free desert. These aren’t truly random; to the customer, it appears that way. But both Panera and Sonic use loyalty systems to trigger rewards to specific customers. You can use attendance records and other mechanisms to identify who gets rewarded even if you don’t have an official loyalty program.

Say “Thank You.” Organizations give things away for various reasons. Sports teams may give away items as a way to promote sponsors, but it’s not really a gift. Make it clear that you are giving this to the fan who is loyal. Thank the fan for attending. Vary the gift by tier; for example, give premium parking to an upcoming game to a season ticket holder who wouldn’t otherwise qualify. But don’t vary the communication – make it clear that this gift is special because the fan is special as an individual.

Listen. One of the most consistent findings in loyalty research is that loyal customers expect to be heard. They are willing to offer input, even anxious, to offer input. But not as many want to do surveys, especially long surveys. Nor is there anything special about an exit survey given to every fan who leaves the stadium. Your challenge is to find a way to listen as you gather the information.

At a Mavs game with a loyal fan last season, my buddy greeted his aisle vendors by name and had real conversations with them. Just last week, I attended a Norfolk Tides game and the guy next to me knew his beer man’s name, the name of the usher, and the cotton candy girl. Your loyal fans know your employees, and your employees hear things. Empower them to be your fans’ spokesperson.

Think creatively. Complaint systems aside, use decisions as an opportunity to gather fan input. For example, when I visit a new-to-me ballpark, I always ask fans for the signature food. All too often, they can’t say there is one – and that’s too bad. A fan voting contest could determine that (along with follow-up promotion to sell more), but you could ask only season ticket holders. Similarly, you could ask them to nominate the vendor of the season. Oh, and while you’re at it, ask a few questions to help you improve service. Yes, it’s doing a survey, but it’s fun (and be sure to report back on who wins).

Respond. When you introduce new things because of fan input, make it clear that’s why you’re doing it. Citibank may be the best at communicating customer input because no change is introduced without acknowledging customers. One result is a higher take-up of new offers, compared to other banks. The thing is, fans want to know that you not only listen but that you act. The action doesn’t have to be specific to what I said or what she said, but the fan does have to believe that you are acting in response to what fans are saying. The research is clear: When customers believe the organization responds to input, whether their own or other customers, their loyalty goes way up.

Oh, and remember those employees. Make them part of the communication process by letting them know why you are doing something new. If a fan asks, they can answer.

Engage Employees. The research is also clear – happy employees make for happy customers. If you follow these tips, you’ve already adopted a couple of actions that will strengthen your employees’ engagement. You’ve empowered them to provide input and you’ve included them in the decision process by giving them the information to be more knowledgeable when talking with fans.

You can wait for a championship season to build loyalty, but even that fades. The type of loyalty that brings them in game after game takes a little work and a lot of creativity, but the benefits are steady and profitable.

How to get started using Big Data in sports

How to get started using Big Data in sports
by Aaron LeValley – April 2015

Big data requires strategy

“Big data” is no longer just a buzz phrase or a passing fad. According to a W.P. Carey School of Business study at Arizona State University, the amount of data accessible for businesses is growing exponentially, with the amount of data doubling every 1.2 years.  Having a plan for this amount of data is no longer a way to generate a competitive advantage, it’s a necessity.

Bobby-Whitson-Headshot
Bobby Whitson

Bobby Whitson, Partner at SSB Consulting Group, summed it up nicely when I chatted with him recently about the growth of big data in sports. “Without an effective data warehouse and management strategy, sports teams will continue to struggle to manage data efficiently, and more importantly, make data actionable.  Big data should be a focus of every team; from generating revenue to creating better fan understanding and engagement.”

charlie
Charlie Sung Shin

It may seem overwhelming when approaching this project, but with a few steps, you can help your organization step in to the future. According to Charlie Sung Shin, Senior Director, Strategic Planning – CRM & Analytics at Major League Soccer, “Developing a big data strategy is a journey and it’s not just about implementing new technology or integrating a customer database. The strategy needs to support and continuously be aligned with your organization’s overall goal.”

How teams can get started with big data

So where do you begin? Here are a few steps which may help you and your organization adopt a big data project.

  1. Establish Objectives.
    1. Meet with your constituents to address short, mid and long-term goals.
    2. Example Goals
      1. Short-Term: How can I use this data to grow revenue for a ticket promotion?
      2. Mid-Term: How can I create a better profile of my customer through all of the data feeds we have?
      3. Long-term: How can we use the data to identify trends to generate more revenue or increase efficiency is aspects of our business?
  2. Identify key data sources.
    1. What are all the sources of data you have, transactional & non-transactional?
    2. Which of these data sources are most important for your objectives?
      • Don’t be afraid to not incorporate some data sources from the start. It’s a process and can be taken in steps.
    3. Data source examples include: Ticketing, Email, Social Media, Website, Surveys, Loyalty, Merchandise, Concessions
  3. Analytical Models / Dashboard.
    1. Aggregating the data alone doesn’t get your team anywhere. Remember (or figure out how) to identify what types of dashboards or statistical models are needed to reach your goals/objectives.
    2. Models/Dashboards examples include: Projecting Single Game Sales, Lead Scoring, Retention Risk Modeling
  4. Identify a partner.
    1. Many sports teams and organizations don’t have the staffing to do this on their own. Make sure you find the partner that fits your needs, be it strategic, technical or other.
    2. Some partners may include: SSB, Teradata, Hadoop, AXS, or SAS

The work doesn’t end there, but if you start with these 4 steps, you’ll be well on your way to bringing your organization to a new level.

Redefining the sports fan

Redefining the sports fan
by Alan Seymour – March 2015

The sports fan redefined?

Are sports fans changing? Recent history and experience suggests they are, for two key reasons:

  1. The power of social media enables the fan experience to enhance the future prosperity of sports brands and properties against competing pursuits. The integration of social media with sporting events makes it unlike any other leisure activity.
  2. The growing importance of fan input on sports properties amidst social media dialogue continues to increase fan identification and engagement with all fan tribes & participants.

The premise that fans create fandoms and tribal associations can be considered a main attribute of sports patronage. Recent surveys & interviews I’ve conducted indicate strong emotional connections, as well as strongly evocative commentaries, among fan tribes.

Social media create distinct and meaningful platforms for fan tribes to flourish. The distinctive nature of immediacy, impact & personalisation enable teams and players to engage in direct dialogue with fans and supporters unlike ever before. The intermingling of Experts, Tribes, and Celebrities via social media exchanges may be referred to as the ETC Phenomenon.

The increasing prevalence of fan tribes

Research suggests fans exhibit characteristics of a cult. [ref]Moutinho et al (2007), “Surf tribal behaviour: a sports marketing application,” Marketing Intelligence & Planning, Vol. 25 Iss: 7, pp.668 – 690. [/ref] There are four distinct types of adherent to this cult of sport, characterized by:

  1. affiliation
  2. social recognition
  3. socialization
  4. symbolism

Football (soccer) is a classic example. Football‐devoted supporters form a kind of cult with a club. We can distinguish distinct fan typologies varying with the level of fan commitment. Members of the cult (or tribe) affiliate through the need for social recognition, socialization and symbolism. Devoted fans gain a knowledge of club association with sponsoring brands, but may not manifest an effective preference towards the brands. [ref] Dionisio et al, (2008), “Fandom affiliation and tribal behaviour: a sports marketing application,” Qualitative Market Research: An International Journal, 11 (1), 17 – 39.[/ref]

My recent research suggests that fan behaviours and associations with new media and technologies reflect their strong patronage and allegiance supporting sports club marketing with corporate partners. Social media involvement within the fan tribe enables new processes for teams to engage with fans. This changing sports media landscape and digital culture now permeates how fans view the team and its associations with corporate partners. How these may lead fans to increase (decrease) loyalty and patronage is open to future research.

Create microfame for fans

Fans are clearly the oxygen of sports business, integral to all strategies from every perspective. Teams should consider the notion of creating “microfame,” where the fan is the true star. Digital campaigns can focus on fostering the growth and community of the fan tribe by generating social recognition for individual fans. Such strategies build a strong socialization within fan communities. A good commercial example is the ‘We Believe’ culture with Harley Davidson followers.

https://www.youtube.com/watch?v=6k0wb6ZK1GM


Leading the tribe

To capture the changing fan, teams will need to be loyal, engaged & above all, digitally savvy. [ref]See, Sport Marketing 4th edit. Mullin, Hardy & Sutton (2014); also, see Rein et al (2006).[/ref]  Sports fans are driving new initiatives as key movers & shakers within the industry, rather than acting merely as spectators. The alignment with fans concentrates on involving them as brand advocates, as much or more so than as consumers of the sporting experience. In the new sports business landscape, what happens off the field is becoming as important as what happens on it. What is your team doing to lead the tribe?

Why the Super Bowl Ads Missed the Mark

Why the Super Bowl Ads Missed the Mark
by Kirk Wakefield – February 2015

Advertisers for Super Bowl 49, at least I’m pretty sure that’s the number we’re on, collectively set the mark for most depressing ads ever. Sure, Fiat, Doritos, Snickers and Supercell did their best to entertain. These are ads we wouldn’t mind seeing again.

Others, however, must have been reading the same research report that people were tired of having fun at the Super Bowl. What these advertisers didn’t realize is that if people wanted to be preached at on Sunday, they would have gone to church that morning.

Why do people watch the Super Bowl?

People don’t watch the Super Bowl to hear a sermon, or to learn something, or to change the world. All those are good, mind you. But, perhaps as a surprise to Nationwide, people eat upwards of 1.25 billion chicken wings, 11 million pounds of chips and 325 million gallons of beer, principally for the purpose of having fun (see other fun facts here).

Granted, one reason for a slate of fare less geared to fun-loving males, is that the Super Bowl is a great opportunity to reach the largest audience of women (46%) gathered at one time. But, the reason advertisers are willing to shell out $4.5 million per 30 second ad isn’t for the one-time exposure to over 110 million viewers. It’s because, like any other sponsorship, Super Bowl ads offer the opportunity to leverage the ad in activating the brand throughout a broader campaign.

Why did the Super Bowl ads miss?

The three (or four) C’s of communication spell out the reasons.

Conversation

Leveraging Super Bowl ads depends on eWom (electronic Word-of-mouth), as well as traditional water cooler talk (tWct). [ref] Note: No one uses this acronym. But, feel free to start.[/ref] We like to share information with others that makes us feel loved, to be included, and to distinguish ourselves from others [ref]Ho, Jason Y.C., and Melanie Dempsey (2010), “Viral marketing: Motivations to forward online content,” Journal of Business Research, 63 (Sept-Oct), 1000-1006.[/ref]. Although open to future research, my guess is that only the few truly enlightened men will be motivated to share with others their feelings about being a dad and how that relates to their choices of Dove or Nissan.

Even if you have relatively high ad meter marks (i.e., 6.0+), that doesn’t mean people are talking about it. And, although I personally liked the Dove ads, overall, men liked it (6.06) considerably less than females (6.70). Such male/female liking differentials are even larger (e.g., 7.65 vs. 8.50 for the Bud’s top-rated “Lost Dog“) among many of the top 25 ads as rated by USA Today’s admeter.

Cost

If we just take the CPM of ads (~$37), there are plenty of other better targeted programs to reach women that wouldn’t include such incredible amounts of waste (recall: 54% of SB audience is male) and hence require much lower budgets in absolute dollars. Further, the “lean-in” factor for women watching the Super Bowl is questionable; surely, women are interested in watching the game on-screen, but not at the same level of intensity as males not wanting to miss a play.

Congruence & Context

Even if advertisers with somber messages have carefully considered the first two C’s, the two biggest reasons communications of any kind do (not) work have to do with congruence & context. Fundamentally, individuals seek out, process and retain information congruent within the context of the situation. We look for things that fit, because it’s easier to connect in the schema of linkages in our brains. Aside from sports, the Super Bowl is about fun and friends. Our brains are wired to look for entertainment, because that is the context of the situation.

We may use contrast, or surprise, to get people to pay attention. But, we do this at our peril–because surprises can be pleasant or unpleasant. An unpleasant surprise results in disgust or distress. These are usually not good things. In any case, a lack of congruence within the context of the Super Bowl makes it difficult to justify the cost because it becomes more difficult to leverage through ongoing conversations people want to have.