Baylor S3 Shifts Gears

Baylor S3 Shifts Gears
by Kirk Wakefield – July 2018

Change is good. We can say, “One day….” or “Day one….” Around here, everyday is Day One.

What’s changing with Baylor S3?

New S3 brand

In 2018 we re-positioned as the Center for Sports Strategy & Sales (S3). Why? Because sponsorships is so 2006, when we graduated our first class in Sports Sponsorship & Sales (see below for a fun blast from the past). Brands engage with fans of properties (and S3) as a partnership not a donation. Thanks to Jose Lozano and The Company, we have a cool new logo.

New S3 Tracks

The strategy in S3 is shifting to build career paths in Brand Strategy, Data Strategy & Sales Leadership. Each track has seven senior-level S3 alumni who advise, create and participate in relevant activities. All S3 partners are invited to join us for any and all of these events.

  • Brand Strategy: Corporations design brand strategies as partners with leagues & teams to attract, engage and keep customers. Agencies help guide brand strategy to reach corporate objectives. Media partners execute brand strategies through event broadcasts and related media. We prepare students for careers negotiating, planning and executing strategic partnerships employing branded content and experiences. The best fit for this track are creative strategists. Partners include:
    • Brands: Phillips 66, AT&T, BBVA Compass, SAP,Denny’s, RMC/Pizza Hut, NRG/Reliant, Topgolf, Daktronics
    • Agencies & 3rd Parties: The Company, BAV Consulting, The Marketing Arm, Baylor IMG, Learfield, Peak Sports, Friedkin Group, 4Front
    • Properties/Teams: Dallas Cowboys, Houston Rockets, Houston Texans, New Orleans Saints/Pels, Texas Rangers, PGA Tour, Space Center Houston, On Location Experiences, Circuit of the Americas, Baylor Athletics
    • Media: Fox Sports Southwest, Root Sports
  • Data Strategy: Sound data strategy enables brands, (eSports) teams, media and agencies to (a) plan, lead, organize and control marketing & sales strategies, and (b) execute digital marketing strategies. We prepare students to create, manage, analyze, report, and deliver actionable data insights & campaigns to drive revenue. The best fit for this track are analytical problem-solvers. Partners include:
    • Companies: 4Front, KORE Software, Stone Timber River, E-15 Group, SSB Info, SEAT Consortium
    • Properties/Teams: Madison Square Garden, Cleveland Cavaliers, Dallas Mavericks, Houston Astros, Houston Dynamo, LA FC, LA Kings/AEG, NBA, New York Yankees, Orlando Magic, Texas Rangers, Utah Jazz
  • Sales Leadership: Sales is the lifeblood of any organization. We prepare students to generate revenue through ticket & partnership sales representing professional & collegiate teams, eSports or third-party rights holders (for NCAA properties). As future servant leaders we value people, purpose and performance, in that order. The best fit for this track are competitive high-achievers.
    • This track isn’t new, but our approach to developing sales leaders and professional selling is. We now have eight Premier Partners helping us change the face of sports sales: Las Vegas Golden Knights, Madison Square Garden, Houston Rockets, Houston Texans, Phoenix Suns, San Diego Padres, Spurs Sports & Entertainment and the Tampa Bay Buccaneers. Read more here under “Sales Leadership Partners.”

No Big Board Meeting, but Big Fridays

To enable equal opportunity for students to pursue and partners to recruit to S3 career paths, we have three separate days for partners, alumni and others wishing to join us. These events are on Fridays, typically before an on-campus sporting event.

  • Data Strategy Day
    • October 5, 2018. StubHub, Stone Timber River, KORE, 4Front & SSB join us for a day of data drama and excitement. Read more & register here.
  • Premier Partner Preview Day
    • November 9, 2018. Premier partners are invited to campus to meet students at the S3 Club Lunch (11:45-1:15) and interview juniors (internships) and seniors (careers) in the afternoon.
  • Brand Strategy Day
    • January TBA (until NBA schedule is released) in Houston, TX at BBVA Compass Stadium for day sessions featuring partnership strategy sessions with BBVA Compass, Phillips 66, Toyota, and The Company, followed by activation in action the same evening at a Houston Rockets game. Stay tuned to www.baylor.edu/business/s3 for updates & registration.
  • Sales Leadership Day
    • February 15, 2019. Hands-on training seminars with team sales managers and partnership sales professionals, followed by panel sessions and interviews for internships & careers. Read more & register here.
  • eSports Day

Want to join us?

Our S3 Leadership Partners and many industry friends built Baylor S3 into what it is today. With our highly selective major, we continue to place over 96% before graduation across every major league and among leading agencies and brands. Working with distinctly innovative minds like Tami Walker (Phillips 66), Patrick Ryan (Eventellect), Kelly Roddy (Schlotzsky’s), Derek Blake (LQ), Adam Budelli (StubHub), Mary Hyink (Fox Sports SW), Heidi Weingartner (Dallas Cowboys), Greg Grissom (Houston Texans), George Killebrew (Dallas Mavericks) and Marc Jackson (Madison Square Garden), S3 students intern, learn and work with the best in the business.

Starting this year, Baylor S3 and Baylor Athletics, with Mitch Mann and Ryan Eklund, will work hand-in-hand on data strategy and student ticket sales projects. Thanks to support from Baylor Athletics, S3 graduate Ian Young is on-board as S3 Research Assistant while splitting time as Research Analyst for Team Sports Marketing LLC.

If you’re interested in learning more about our program and potential involvement, please feel free to inquire.

Are Silicon Valley Teams as Data-Driven as You’d Expect?

Are Silicon Valley Teams as Data-Driven as You’d Expect?
by Brad Sherrill – October 2017

With Apple’s headquarters right down the street, you would expect the teams in Silicon Valley to be digitally-savvy and data-driven. We were not disappointed, as the teams from San Jose demonstrated how they employ business intelligence to generate revenue.

Sharks Leadership Analytics-Driven

Flavil Hampsten, Executive Vice President & Chief Marketing Officer, began honing his sales & marketing analytic skills to drive revenue while completing his MBA at Arizona State in 2009 and serving as Vice President of Ticket Sales at the Phoenix Coyotes, before heading to the Charlotte Hornets and now back in the NHL at the Sharks. Neda Tabatabaie was brought in at the Sharks to implement a cohesive data strategy when Mr. Hampsten arrived in 2015.

CRM Boosts Sales

S3 graduate McKenzie Bryan said, “I really enjoyed hearing from the Sharks on how well they integrate CRM/Analytics into the sales department and all of the ways a solid CRM system helps sales.” The Sharks organization encourages utilization of CRM to achieve more efficient and effective sales numbers. Beyond this, however, the Sharks want salespeople to be analytical and intentional as they attempt to make connections with current and future fans.

[slideshow_deploy id=’10035′]

49ers Commit Headcount to Analytics

Hayley Di Naso, Hospitality Sales Executive (S3 ’15), hosted us at the 49ers. Following a stadium tour, Demar Amacker and Paul Epstein explained the organizational structure and integral nature of CRM as strategy working hand-in-hand with sales. The Business Strategy & Analytics group, led by Moon Javaid, includes five staff members with analytics responsibilities.

S3 Senior Jacob Kurian appreciated how “every aspect of the experience at Levi’s Stadium has been thoroughly planned out.” The 49ers have created an authentic atmosphere in the stadium that reflects much of what people in the area value. Levi’s Stadium uses repurposed redwood finishing in its concourses and has 16 (Joe Montana’s number) native plant species growing on the patio atop the building. The stadium also showcases an impressive collection of local artwork.

[slideshow_deploy id=’10028′]

Next up

We completed the S3 StubHub Analytics All-Stars trip with visits with the Warriors and Giants. Stay tuned for our next report!

CRM Made Easy: How to Track Account Renewals

CRM Made Easy: How to Track Account Renewals
by Michael Hurley – September 2015

Are you using your CRM system to project final renewal numbers? Are you able to identify accounts that might be harder to renew?

The Way We Were

In 2012, during my first renewal campaign  with the Houston Astros working with then Director of Season Ticket Services, Alan Latkovic, our “CRM system” was an Excel spreadsheet with every single account listed as a line item and the columns  laid out to reflect “touch points” or times of contact with Season Ticket Holders (example below).

hurley tpm

This method of touch point management worked in lieu of an actual CRM system. But, there isn’t much tracking and it’s not easy to project renewals. When we rolled out Microsoft Dynamics CRM before the 2013 renewal campaign, our eyes were opened to the benefits of tracking renewals. Today, after years of tracking accounts and tendencies, we can project renewal numbers to the percentage point even before we receive the first response.

Using renewal scores we have real-time information on which accounts require a little more “love.” We quickly see which accounts have not responded at all. We strategically plan an offsite visit with them and maybe even take Orbit along.

orbit

Using CRM to Track Renewals

Alan Latkovic (@AlanLatkovic), Senior Director of Season Ticket Services and Operations with the Astros, accentuates the importance of using  CRM to track renewals and project the final renewal numbers.

“With the tools of CRM we are able to score accounts who respond to the initial renewal call daily, monthly, and annually.  Providing this data to our analytics team, we are then able to project renewals and carry the information over each season to create new renewal benchmarks.”

Tracking every conversation and response for each account ultimately makes the big picture become more clear. The Astros use a very simple but effective renewal tracking method throughout the renewal campaign. We categorize accounts based on an initial indication of renewal.  If an account’s initial response to us when they receive their invoice is that they are not renewing, we mark them as “unlikely to renew” in CRM, at the same time if an account lets us know they are planning on renewing and processing the invoice, or “the check is in the mail” we mark them as “likely to renew” in CRM.  Using renewal scores, we can project what an account will do, and by tracking the data of renewal scores over time, we then have an idea of what percentage of accounts in each score grouping will ultimately renew.

The Importance of Tracking Renewals

When it comes down to it, we simply cannot overlook the importance of tracking renewals and building renewal campaigns around the tools of CRM. Katherine Tran, Manager of Membership Services with FC Dallas, stresses the importance of being able to forecast future renewal cycles by using CRM:

“The importance of tracking renewals is second to none.  It allows teams to pinpoint customer trends over the seasons and helps forecast future renewal cycles.  Teams can plan their renewal efforts and campaigns based on data from previous years.”

When following trends in renewals over the years, and knowing which accounts renew and when, a much clearer picture emerges when forecasting renewal numbers.  While using Excel will get the job done, it’s no comparison to the benefits a true CRM system provides.


Cover photo courtesy of Ezhil Ramalingam, India.


The Impact of Data Visualization in Sports

The Impact of Data Visualization in Sports
by Katie Morgan – November 2014

Teams constantly research to find new data sources to enhance business. Data is the life blood of the organization. Data provides the ability to make key decisions based on factual information rather than projections based on personal experiences.

Big Data Questions

Some of the biggest questions teams face when finding new data sources include:

  • Now that we have all of this data, where do we store it?
  • When our data is in a usable format, how do we compile the information for our decision makers?

The Texas Rangers currently use a data warehouse to store all of our various data sources including:

  • Historical and Current Ticketing Data
  • Demographic Information
  • CRM Data
  • Team Performance Data (present and historical)
  • Weather Information (present and historical)
  • Secondary Market Data

Why do you need a data warehouse?

Justin Foote
Justin Foote

Justin Foote, Interactive Database Coordinator with the Texas Rangers, highlights benefits of using a data warehouse to store data.

“The use of a data warehouse has given us the ability to store and report on data, both past and present. Access to fan’s previous purchasing habits is crucial in determining future trends amongst our fans. Without the warehouse, the reports and visualizations we are using would have taken days to create, as opposed to  a couple of hours.”

Data provides you the information to help with various initiatives such as:

  1. vetting the best leads to distribute to sales representatives,
  2. provide real time visualizations,
  3. offer information on purchasing trends,
  4. provide the ability to do comparative analysis year over year, and various other projects.

Visualization with Tableau

The Texas Rangers, Cincinnati Reds, and Pittsburgh Pirates all chose to use a data visualization tool, Tableau, to provide dashboards on various initiatives and projects.

Jason Witzberger
Jason Witzberger

At the Pirates

Jason Witzberger, Manager of Business Analytics with the Pittsburgh Pirates, has been a Tableau user for just under a year. He states:

“The Pittsburgh Pirates use Tableau to visualize sales and marketing trends in real-time.  With Tableau, we have access to the most up-to-date information represented in a dynamic visual format, all available from any location.  Tableau makes the data easy to understand so that we can make smarter and more proactive decisions.”

Jason points out several key benefits to using a data visualization tool:

  • Access to the most up-to-date information. Whether you are making a key decision with your data, or trying to show a new trend, having the most up to date information is of utmost importance. The Texas Rangers update data every fifteen minutes in order to provide the most accurate information to the individuals using the data resources.
  • The data is easy to understand. When providing data to decision makers and others working on a specific initiative, you always want to provide easy-to-understand information. A simplified visualization provides imperative information in an readily comprehended format. Remember the audience and cater visualizations to their needs.
Chris Calo
Chris Calo

At the Reds

Visualization tools, and in this case Tableau, offer several different ways to represent data. Chris Calo, Business Systems Analyst with the Cincinnati Reds, uses several different types of visualizations to highlight important information for his organization.

“Tableau has helped Reds management view data in a totally different way.  Whether it is a stadium heat map, viewing suite availability in real-time, or filtering through data reports, Tableau has made the understanding of data a much easier process with their visualization tools.”

At the Rangers

The Texas Rangers currently use Tableau to showcase the following information:

  • Real Time Ticket Sales updates
  • Actual Sales vs Budgeted Sales Comparisons
  • Sales Representatives Inbound and Outbound Calls
  • Real Time Game Day Turnstile Reporting
  • Real Time Merchandise Sales
  • Breakdown of Ticket Sales in our various box offices, concierge, and phone room
  • Cell Phone Anaylsis
  • Seasonal Employee Payroll Monitoring

Use your data visualization tool to showcase data in easy to view, eye catching, and easy to understand format. These tools provide you with a plethora of options, and it’s key that you find the visualization that enhances the data you are showing so that a quick and productive decision can be made for your organization.

An abundance of unformatted data can seem like a daunting task. However, with the appropriate plan in place any team or organization can convert the data into a usable format and begin visualizing real time information in a brand new way!


 Cover photo courtesy of http://www.tableausoftware.com/ 


Why the best teams and brands partner with academics

Why the best teams and brands partner with academics
by Kirk Wakefield – August 2014

Back in the early 1990’s, I started out with my Baseball Almanac contacting major and minor league teams to conduct research. Being at Ole Miss during that time, just an hour south of Memphis, I made quick friends with every pro franchise that came through town–among them the Memphis Chicks, Memphis MadDogs (CFL), Memphis Fire (USBL), and Memphis Redbirds, where I managed their fan research for three summers before leaving for Baylor in 2002.

During the ’90s, I recall a visit with a vice-president of marketing at a MLB team in the northeast about collaborating on fan research. He thought it was all very interesting, but said they weren’t interested because, “We already did one fan survey this year.”

Times have changed and MLBAM has taken the league and its teams to the front of the class in understanding its fans. However, one paradox I learned still holds today:

[dropshadowbox align=”center” effect=”lifted-both” width=”300px” height=”” background_color=”#ffffff” border_width=”1″ border_color=”#dddddd” ]

The best organizations always want to know more and the struggling rarely want help.[/dropshadowbox]

Why do the best get better?

Derek Blake
Derek Blake

Everyone who’s read “Good to Great” knows that the best leaders have an intense drive coupled with humility. This combination is what makes any leader get better because first they want to and second they know they don’t have a corner on knowledge. Derek Blake, Vice President, Partnership Marketing, La Quinta Inns & Suites, demonstrates this kind of leadership. Derek shares how this plays out in working with educators,

Business today is always evolving and we want to be on the cutting edge.  Working with academics who are experts in a very specific field of study – like corporate partnerships – just makes sense.  By giving back to our educational institutions, we help build the foundation of who students become in the future and that’s where we all benefit.

Some of the greatest franchises in the world are literally right up or down the road from us here in Waco and they always want to learn more. Some might think the San Antonio Spurs have accomplished all they need to after five NBA titles and operating above 99% attendance capacity. But from the top to the bottom of that organization, they always want to get better and are always open to new ideas, new methods, and new approaches to satisfy and grow the fan base.

Eric Sudol
Eric Sudol

The Dallas Cowboys are the NFL’s most valuable franchise, but their executives never hesitate to explore new ideas and to partner with us on research and classroom projects. Eric Sudol, Sr. Director, Corporate Partnerships Sales & Service at Dallas Cowboys, adds, “Teams are always busy and we can save time and money by partnering with academics when our interests overlap with their research needs.”

Much the same can be said of Baylor’s other partners around the state, both corporate and sports organizations. Further, aggressive teams like the Padres, Browns, Chiefs, and Dolphins work with us to take an innovative partnership approach with corporate sponsors to provide valid measures of sponsorship returns.

Why (not) work with academics?

WCAI Partners
WCAI Partners

ESPN and the Sports Analytics Conference partner with MIT. Wharton’s Consumer Analytics Initiative (WCAI) works with a variety of corporate partners (see right) and also works with sports teams. Yet, some corporate and sports organizations are hesitant to engage with academics.

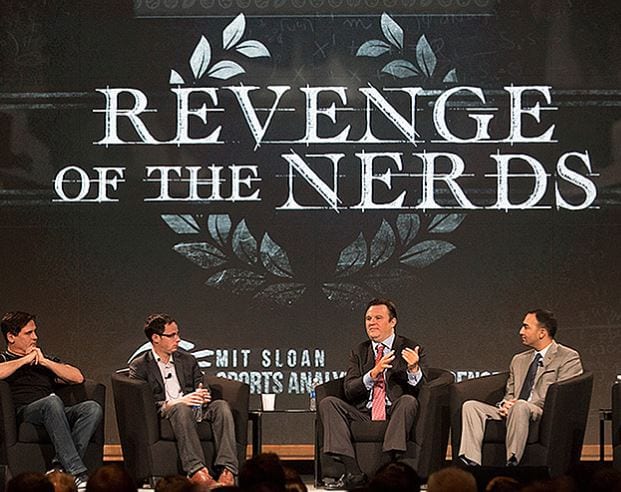
Hey, I get it, we’re a little weird. Some of us are a lot weird. There’s a reason the Sloan Sports Analytics Conference is called a “nerdfest” and hosts a panel entitled, “Revenge of the Nerds.” But, for the fearful, here are three reasons you should work with academics:

  1. Focus. At research institutions like MIT, Wharton, and Baylor, faculty are experts in very specific fields. Aside from service responsibilities, typical workload is 50% research & 50% teaching. We spend 2-4 days a week, about 50 weeks a year, often for many years focused on finding out what’s new in one or two areas–which leads to the next point.
  2. Innovation. Academics are rewarded for publishing research. Research gets published (ideally) only when we learn something new. In contrast, syndicated research firms are rewarded for standardizing and commercializing past practices.
  3. Confidentiality. If you read the Sports Business Journal and popular press, you might think academics will want to publish the name of the team, the executives, and specific financial or customer data. In sharp contrast, academics do the opposite for two big reasons:
    1. Research is published when it’s generalizable to other situations. Sports is just the laboratory to study interesting phenomenon. We often don’t state the specific team or location because then someone would say it might not apply elsewhere.
    2. Research is based on the relationship between variables or fields in a data set–not the levels. In other words, we care about the relationship between X and Y, not the levels of X and Y. So, if you had data on fan demos and expenditures, we don’t care about the amounts–we care about how much variable X (e.g., tickets used) influences variable Y (e.g., renewals). What we report is the strength of relationships.
  4. Expense. What academics need most is data. If you can provide access to data, most academics will trade time for cool data. Obviously, our institutions and programs need support so we can conduct research and teach the future business leaders of the world. Partners understand that (e.g., WCAI, above), of course. But, essentially, all we need is access.

And we thank you for your support.

Evolution of analytics in sports: What’s next?

Evolution of analytics in sports: What’s next?
by Aaron LeValley – April 2013

There has always been the adage that professional sports teams are 5-10 years behind the ‘normal’ business world in terms of technology, business practices, and strategy. Are we starting to see the sports industry close that gap? After seeing some of the topics discussed at the 7th annual MIT Sloan Sports Analytics conference, it seems we’re heading in the right direction.

Money got the ball rolling

The movement began in the early 2000’s with the evolution of “Moneyball” on the personnel side. Baseball led the way in utilizing complex statistical analyses to determine personnel and in-game decisions.

On the business side, teams and leagues explored the database marketing and CRM frontier by hiring individuals to help sales teams manage clients and prospects. We then saw the evolution of the database marketing role into deeper, more complex analyses with lead scoring models, retention models, and more.

Russell Scibetti
Russell Scibetti

Russell Scibetti, Director of Relationship Marketing for the New York Jets said, “From when I first began over three years ago to where we are today, the Jets have seen the benefits of taking a deeper look at our season ticket holders and fans.”

Recently, we’ve seen organizations create roles extending beyond database marketing into business analytics. Aggressive teams are hiring individuals who:

  • can help price tickets to maximize revenue,
  • build complex reporting and marketing queries, and
  • dive into sponsorship valuation.

Catching up

Which brings me back to this year’s Sports Analytics Conference. Rather than just focusing on sales and marketing, we saw research on topics like

  • multi-model neuroimaging to analyze the batter’s recognition of a baseball pitch,
  • an NFL presentation explaining how the time of day and gender affect the way sales teams should approach a sales call, and
  • great panels on how analytics influence social media, sponsorship, and customer loyalty.

All of these demonstrate how the sports industry is putting a greater emphasis on being more business savvy, using analytics to catch up to the ‘normal’ business standard.

Vincent Ircandia
Vincent Ircandia

Vincent Ircandia, Vice President of Business Operations for the Portland Trail Blazers, “We are using analytics within all aspects of our organization from finance to sponsorship, to broadcasting and beyond, and have buy-in from the top on down.”

Ideas for analytics projects

As your organization moves forward in this area, here are three projects implemented at various teams that can help:

1)      Sales & Service: Build a model that predicts a season ticket holder’s likelihood to renew

2)      Ticket Operations:  Create a new reporting structure with tools like EXCEL and advanced SQL reporting services

3)      Finance: Work with management and finance to build 5-10 yr pro forma financial models forecasting  revenues and expenses

What types of analytics projects are your organization working on?  What’s next? We would greatly appreciate your feedback in the comments below.