StubHub Ticket Insights: Changes in Who, How & When People Buy

StubHub Ticket Insights: Changes in Who, How & When People Buy
by Kirk Wakefield – May 2017

In a league of its own

StubHub sells a ticket at least once every second. Over 21 million unique highly qualified buyers visit StubHub every month. Last year (2016), StubHub sold over $4.2 billion in tickets. That total essentially places StubHub in a league by itself, comparable to the NBA or Premiere League and more than the total revenues of the NHL, Bundesliga or La Liga.

Thanks to our S3 partnership with StubHub and Geoff Lester, our friends Charlie Rockman and Nick Rudolf presented breaking insights at our annual S3 Board Meeting in January, 2017.

In this article we present three of these insights related to demographics, search habits and mobile use in ticket purchase. Next month we will follow with insights on geo-targeting, conversion to ticket plan buyers, and inventory management given the timing of purchase behavior.

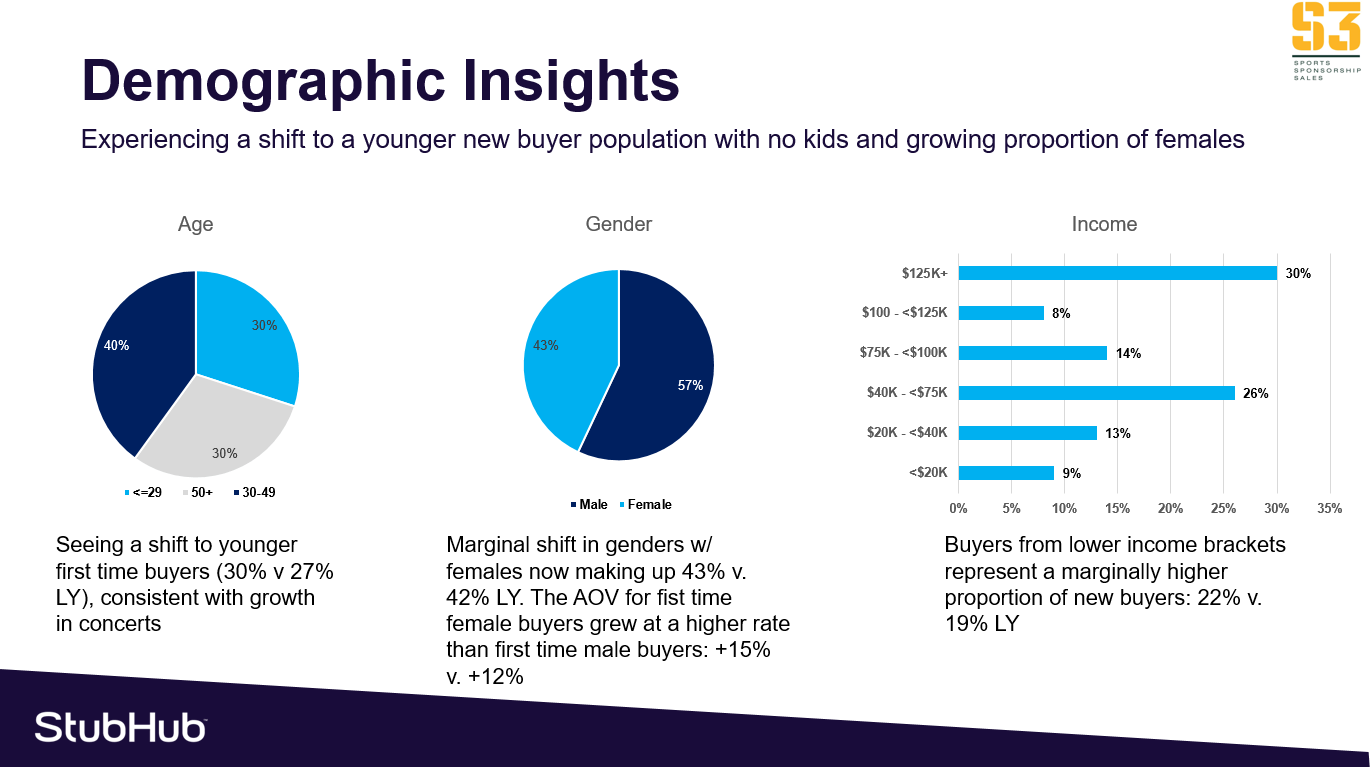
Demographics of online ticket buyers

Knowing half the females in the DFW metroplex are Dallas Cowboys fans, the Cowboys launched www.5pointsblue.com to offer content written by female staff members. The content appeals to the female fan base, but a broader audience as well, generating 350,000+ monthly visits. Other properties would do well to emulate the initiative to serve its entire fan base in a way that meets needs and preferences.

As seen below, we see a slight shift in females buying online (43%), but more importantly the Average Order Value (AOV) increased among first time female buyers versus first time male buyers. As millennials overtook baby boomers as the largest generation this past year, so has the percentage of younger buyers. These young buyers may see concerts and other events as viable entertainment options to sports. Commensurately, we see more lower-income first-time buyers–who will be tomorrow’s potential season ticket holders. The question is: How are teams serving the buying needs of this younger segment that will translate into future ticket buying fans?


Ticket Search: Event, Team or Date?

Knowing how people search is one of the keys to successful Google AdWords campaigns. Which of these is most likely to show up in a relevant search?

  • Event (Cavs vs. Rockets)
  • Team (e.g., Cleveland Cavaliers) or artist (Justin Timberlake)
  • Date (Friday, December 1, 2017)

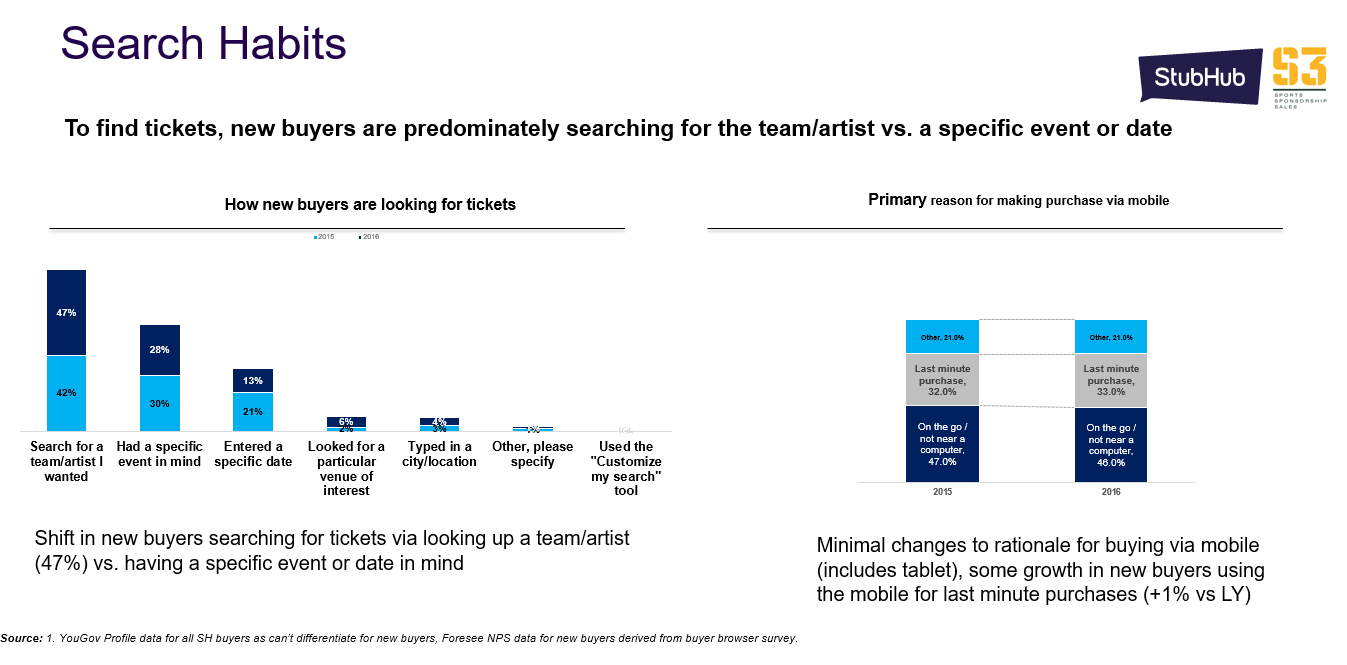
We might think new buyers typically want to see a specific event on a certain date. We would be wrong. Instead, buyers increasingly and foremost search for the team or artist, rather than having a specific event or date in mind. Furthermore, last minute purchases (33%) and on-the-go (not at home/office) are the major reasons for purchasing via mobile. So, if we want to reach people where they are–with phones in hand–we best be mobile and search-engine optimized for quick access.


Mobile First Strategy

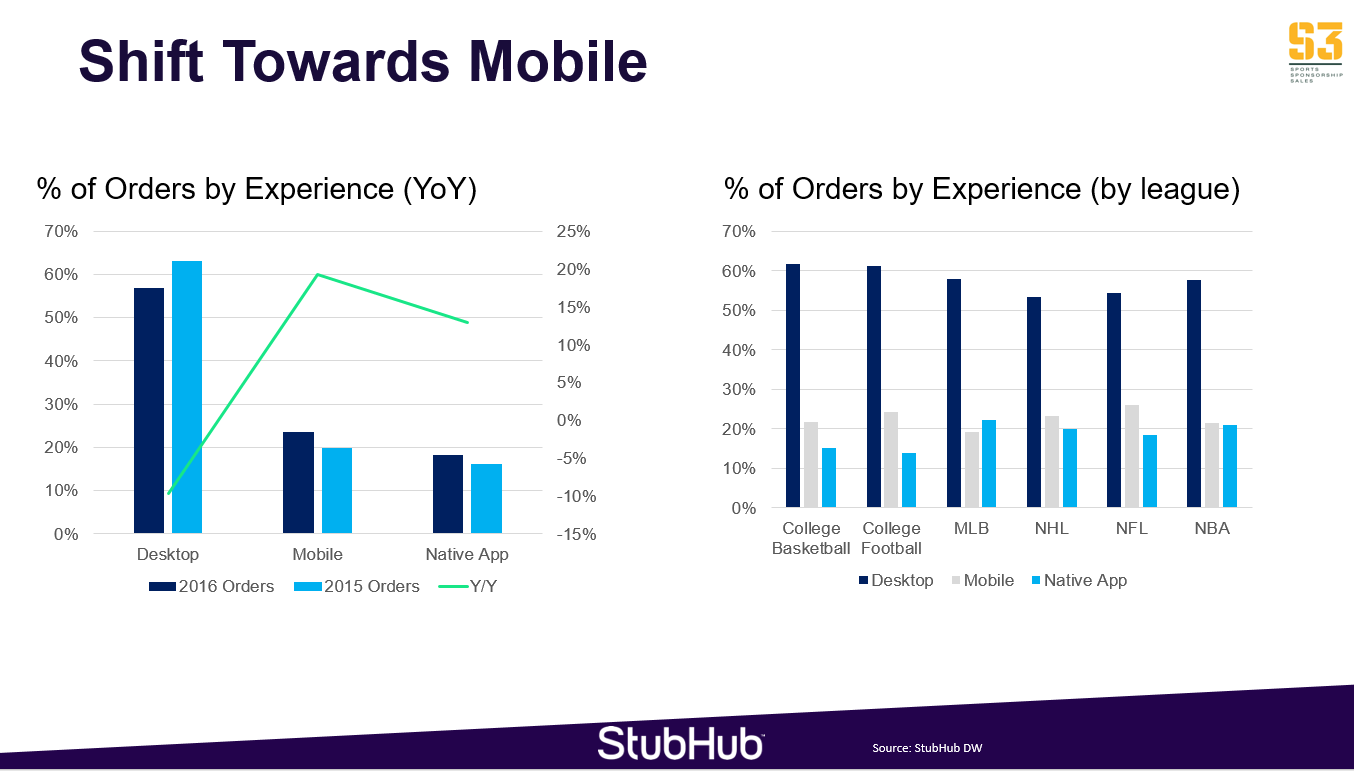
In 2014, 41% of traffic and 20% of sales came via mobile for StubHub. Just two years later, 60% of traffic and 42% of sales came via mobile. In general, revenue from 2015 to 2016 is increasing via online purchases, but disproportionately via mobile in terms of tickets sold (+25%) and total sales (+44%) compared to tickets sold via desktop (-3%) and total sales (+10%). (See graphic at the top of this article.)

Expect the trend toward mobile to continue. In the past the majority of time spent on mobile was searching, but most purchases of goods and services were made on desktops. But, as StubHub and others with native apps improve the mobile experience, more will shift to mobile purchases.  As seen below, the majority of purchases are still on desktops, but more bought via mobile devices and native apps in 2016 than 2015. The most mobile-friendly buyers are football (NCAA & NFL) fans, but the growth in mobile purchases will extend across leagues.


Conclusion

In short, the takeaway insights are:

  1. Target females the way they consume content and make purchases.
  2. Manage search engine campaigns aimed at team/artist searches, more so than event or date.
  3. Optimize for mobile ticket purchases. If your mobile sales are not growing at the same rate as the market, you are not mobile optimized.

When do people buy? And what happens to average ticket price over time? We know over one-third now wait until the last 72 hours to purchase. To learn more, come back for next month’s release.

The Online Ticket Buyer: By the Numbers

The Online Ticket Buyer: By the Numbers
by Kirk Wakefield -October 2016

Nationwide Study of Recent Online Ticket Buyers

Efficient and effective salespeople convert ticket buyers into season ticket holders and serve their needs. However, the secondary market is the primary market for many fans who do not differentiate between buying from StubHub, TicketMaster or the team’s website. What do these buyers look like? How do they buy? Where do they buy? What is important to them?

The Online Ticket Buyer Profile infographic offers an overview of our initial findings from a wide-ranging study of 688 recent online ticket buyers of tickets. Given the time of year and panel source, we draw primarily from NFL, MLB, and NBA ticket buyers, but also have representation from NHL and a few MLS buyers. All bought tickets within the past 12 months.

We will present more in-depth results and insights at the Baylor S3 Annual Board meeting, January 17-18, 2017. Students will present analysis & insights to the industry on December 5, 1-4pm. Guest judges are welcomed.


Selling Experiences Online: Announcing the BAV-S3 4V® Brand Index

Selling Experiences Online: Announcing the BAV-S3 4V® Brand Index
by Kirk Wakefield – June 2016

Juniper Research classifies ticketing as one of the primary commerce applications driving eCommerce, estimating over one-fourth of ticket purchases will go mobile in the U.S. by 2020, and over half of ticket purchases outside of the US and Europe to be mobile-based by 2020. Teams like the Portland Trail Blazers renew season tickets via mobile devices and continue to see fans more comfortable in making both small and large transactions on mobile apps.

While we in the U.S. may think life moves at the speed of digital, we move at a snail’s pace compared to the growth in China, where the average consumer spends 45 hours online a week (10+ over global average). B2C e-commerce in China is expected to grow at a 30% clip from 2016-2020. As sports-related brands seek a global presence (like Barcelona and Real Madrid), teams and vendor partners must focus on engaging fans in the ways fans desire, rather than only what is expedient or profitable in the near term.

The quality of the consumer experience with the brand in online ticketing will determine the winners and losers as the world turns increasingly mobile. How do we know who’s winning? Who’s winning so far?

The BAV-S3 4V® Brand Index

The BrandAsset Valuator (BAV®) database is the largest and leading quantitative, empirical study of brands and consumers. Spanning 16 years, 51 countries, and over 680,000 respondents, BAV is the world’s largest database of brand perceptions; containing ratings on over 43,000 brands on 72 dimensions.

In collaboration with BAV, we developed the S3 4V ® Brand Index that evaluates online brands in terms of three positive dimensions of value, vision, and social vibe and one negative dimension of vanity. Customers favor online brands that demonstrate:

  1. Value: The leader, the best brand online characterized as (having)
    1. good value and worth more,
    2. trustworthy and reliable,
    3. simple and straightforward,
    4. high quality and high performance,
    5. original, authentic, down to earth and traditional
  2. Vision: The progressive, innovative, up-to-date, intelligent, visionary brand that is gaining in online popularity.
  3. Social Vibe: The brand that represents a fun, social, friendly, and charming online persona.

Customers discount or disfavor brands trying to score style-points without substance. Online visitors pick up on signs of Vanity, characterized as attempts to appeal to the upper class on the basis of glamour, style, prestige, sensuality, and trendiness. We find this has a negative effect on regular brand usage.

Together, these four dimensions explain over 50% of consumer usage of the brand. That amount of variance is another important V to consider as brand compete to win customers to their online real estate.

The Winners

The 4V Brand Index covers 278 brands that offer some form of online experience across a dozen sectors. Our index places weights on each of the four Vs in an equation that best predicts brand usage. Scores range from Amazon on the high end (29.02) to ISIS (-7.24) on the low end. Sectors include mobile phones, with iPhone and Samsung Galaxy outclassing all other comers by large margins. More interesting is competition among mobile payment vendors (Amazon Local Register vs. Apple Pay vs. Square), internet tools and services (Google Maps vs. MapQuest), or social media (how is Snapchat doing against Facebook, Twitter and LinkedIn?).

But, since we’re all about sports first, that’s where we will begin. The table may be sorted based on the overall index score or each of the 4Vs.

[table id=4 /]

Ticket sellers

Although tickets are only a part of their businesses, eBay and Groupon lead the way in offering online experiences that customers perceive as offering value, vision, and vibe that outweigh attempts to appeal to the vanity of buyers. Given shopper motives for buying online, the strongest predictor of brand usage in our equation is value, followed by brand vision.

Between the two leaders in ticket sales online, eBay’s subsidiary, StubHub (8.56) performs better than Ticketmaster (7.13), primarily due to vision (13.29 vs. 10.52) and social vibe (12.61 vs. 10.54) customers get when they visit their websites or use their mobile apps.

In the future, we will add SeatGeek and VividSeats to the index, two ticket sellers with significant investments in online and mobile ticket distribution.

The Losers

Fan Duel and Draft Kings suffer from high vanity scores and low value scores. Being new and on the cutting edge (vision) helps attract customers, but a brand’s longevity is in question if it cannot deliver value.

On a broader scale, sports teams must be mindful of partnering with online brands with negative personas. The two lowest rated online brands (ISIS and Al Jazerra) clearly aren’t potential partners, but not far behind are Foursquare (4V = .13) and Tinder (4V = .18). Granted, these might target specific fan segments, but the signal sent to all customers may not bode well for the team and its other brand partners. Brands with relatively low 4V scores may be due to overall low market strength and penetration. Customers don’t necessarily hold negative perceptions, but may hold no perceptions at all about the brand.

Looking forward

In future analyses, we will take a closer look at ticket sellers to examine the specific features and drivers of customer online experiences.