An Internship Model for Sports Sales, Marketing, CRM & Analytics

An Internship Model for Sports Sales, Marketing, CRM & Analytics
by Kirk Wakefield – January 2017

After arranging & supervising hundreds of sports internships for the last dozen or so years, Dr. Darryl Lehnus and I devised a system that works well for us.

Ideally, partners provide the internship with the same objective of developing and evaluating talent in view of future employment there or elsewhere. Our partners see intern successes as their successes, as it reflects on their abilities to train, motivate, and model excellent performance.

Among others, the Pittsburgh Pirates B.U.C.S Academy and the New York Mets are ahead of the game in organizing internships and recruiting to careers. While many teams and companies provide summer internships, the Houston Texans (sponsorships) and Houston Astros (CRM) provide 9-12 month postgraduate internships specifically for our graduates to gain more in-depth training before launching careers.

Our best-in-class partnerships do five things:

  1. Budget for internships.
  2. Show up every year to interview.
  3. Provide awards or incentives. (Examples: See StubHub & MLBAM.)
  4. Serve as mentors.
  5. Initiate follow-up with interviews to (a) hire or (b) refer for hiring.

Five Not-So-Easy Steps

From a process standpoint, partners follow these five steps. We’ll explain each in turn.

  1. Prepare students for careers.
  2. Determine parameters & responsibilities.
  3. Define, communicate and evaluate on criteria that predict success.
  4. Hold students responsible.
  5. Review insights & follow-through with students.

Prepare students for careers

Ask employers what they want. Continue to ask.

Too many prepare students for sports marketing or sports management jobs. The only problem is no entry level positions exist for “sports marketer” or “sports manager.” Entry level positions do exist in ticket sales, sponsorship sales & service/fulfillment, CRM, and analytics. Design coursework and programs accordingly.

Business schools have courses in professional selling, database management, statistics and predictive modeling, and data visualization (Excel, Tableau, etc.). Take advantage of these courses in planning curriculum requirements. When employers see you take them seriously, they’ll line up for your students.

Determine Parameters & Responsibilities

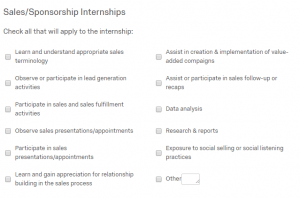
Once employers agree, we send them a link to an online form to identify the supervisor, time frame (start, finish, hours per week, pay or course credit), and responsibilities. Most likely you’ve already discussed this, but best to not be surprised at the end of the term that the internship didn’t include a vital part of what they needed to experience.

After selecting the type of internship, the employer completes the appropriate section for what the intern will do. Our forms are below.

Define, communicate and evaluate criteria for success

Every year the National Association of Colleges & Employers (NACE) publish a list of attributes most desired of new hires. These could differ among some, but odds are they are the same. With a little adaptation, we use these for midterm and final evaluations by the intern’s direct supervisor.

Responses on the primary criteria (below) are shared with the intern in a meeting with the academic advisor. We also ask about punctuality, attitude, performance, and overall grade from the direct supervisor of the internship at the employer. The entire form may be downloaded here.

Sports Internship Evaluation Criteria

Specific to our own preparation and values, we ask students to be 2nd milers. When asked to do something (walk a mile), go above and beyond expectations (go the second mile). Supervisors rate the intern accordingly (below).

Hold students responsible

Students should perform well in the internship. We expect that.

We also expect them to reflect on what they learn. Keeping a daily or weekly journal is recommended.At the end of the term, students must submit the S3 Internship Report Form (click to download) regarding a weekly log of hours, assignments, volunteering, accomplishments, application of class material, issues (problems or challenges & resolutions), culture, behavioral adaptation, recommendations, and net promoter score rating for the internship.

Review insights & follow-through with students

Meet with each student to get his or her take on the evaluation provided in Step 3. Usually there are no surprises. Employers do a good job of picking up on areas for improvement that you’ve likely noticed in class. So, it’s nice to have someone else see it and say it.

Generally, these are great times to encourage students in careers. On occasion, you can use these to give appropriate kicks in the pants. We’ve seen these have fairly drastic effects on capable students who needed to get with the program. On occasion, you find some who need to find another program. The wide world of sports, perhaps the same as other industries (but we think more so),demands a high level of commitment. We help students by holding them to a high standard.

Conclusion

Providing good internship experiences takes effort on the part of the academic advisor, student, and employer. But, working together, internships are the foundation for successful careers. No class, book or assignment can substitute for on-the-job reality training.

The very best part of what we do is to see students succeed in their careers.

Feel free to borrow, steal, or adapt any or all of the attached materials! If you’ve found other things that work well, please let us know!

Sport Business Analytics: A Review of Harrison & Bukstein’s Book

Sport Business Analytics: A Review of Harrison & Bukstein’s Book
by Kirk Wakefield – January 2017

Business intelligence is old school. Business analytics is new school. Sport business analytics is finally going to school. In the past decade, interest grew beyond the 100 or so nerds at the first MIT Sports Analytics Conference to  sellout crowds (>3000 geeks and wannabes) today. At the same time, courses and programs have emerged to educate tomorrow’s sports business analysts.

To that end, C. Keith Harrison and Scott Bukstein, of the University of Central Florida, compiled a collection of 13 chapters (plus a chapter on teaching a related class) from professionals and academics for their edited book released by Taylor & Francis, entitled, “Sport Business Analytics: Using Data to Increase Revenue and Improve Operational Efficiency.”

In all fairness, I acknowledge a number of the chapter authors are associates. My intent, then, in this book review is to not treat them as I do my friends, but will instead try to be considerate and complimentary.

The Evolution & Impact of Business Analytics in Sport

The question, “What is analytics? Really?” is often raised among academics. Professors and data scientists tend to think of analytics as using advanced statistical techniques to model and predict behaviors based on (big) data. Practitioners may refer to analytics when they really mean reporting.

In the opening chapter overview of the text, Scott Bukstein states the core purpose of sport business analytics is “to convert raw data into meaningful, value-added and actionable information that enables sport business professionals to make strategic business decisions, which then result in improved company financial performance and a measurable and sustainable competitive advantage.”  In short, analytics is any “data-driven process as well as any actionable insights derived from data.”

Consistent with this understanding, the book chapters provide good case examples of data-driven processes that produce actionable insights. In large part, many of the chapters read as a series of case studies with examples of how organizations implement analytics. The chapters provide instruction to understand what leading teams and companies do on a day-to-day basis, as well as propose thought-provoking ideas for practitioners.

Ticketing Innovation

In Chapter 2, Jay Riola offers replicable examples of how the Orlando Magic use customer data to target and engage fan segments through appropriate digital channels and devices. Other teams would do well to learn from the success of the Magic’s Fast Break Pass and season ticket holder app, as thoroughly explained by Jay in this chapter.

Using ticket pricing analytics, Troy Kirby does a great job explaining how the secondary market is the primary market, in Chapter 3. Troy makes the argument that a ticket may eventually evolve beyond its current revocable license legal status to a material good, allowing greater freedom for fans to use and resell however they wish. The practical upshot of these two chapters is teams must more quickly adapt to digital channels–whether owned by the team or others–to provide value to fans. Teams with NIH attitudes will suffer.

Data Management & Marketing

Ray Mathew offers a basic understanding of how teams use CRM to gather and analyze customer data for use in targeted marketing campaigns in Chapter 4. Since CRM coordinators are typical entry-level positions, interested learners should be motivated to self-learn, intern, or take courses in CRM to prepare for careers in data management in sports. This chapter provides a good foundation for students to understand if this is a viable career path for them.

Michael Farris provides an overview of the Aspire Group’s 8-point ticket marketing, sales and service philosophy in Chapter 5. Academic programs lacking courses in marketing strategy will benefit from the Aspire Group’s marriage of marketing with analytics. Programs housed in business schools will also appreciate founder Bernie Mullin‘s sound approach to management and marketing. The application of the model to the experiences of Georgia Tech are particularly insightful for NCAA programs. Plus, students in classes adopting this text will go into interviews with Aspire knowing what they’re all about!

Research & Applications

Chapter 6 leans closer to the professor or data scientist’s POV of business analytics. Michael Lewis, Manish Tripathi and Michael Byman address the importance of calculating, tracking, and managing customer lifetime value (CLT) and related functions of brand and fan equity. CLV is critical to model retention and seat-buying decisions. The authors present insights into NFL team’s fan equity and social media equity to pinpoint pricing and promotion opportunities. Updates among leagues are available on Michael Lewis’ blog at Emory University (follow link here).

John Breedlove illustrates how teams use analytics to improve the performance of sales reps with targeted campaigns to open the door to warm leads. In this chapter (7), John illustrates the importance of keeping analytics simple to increase efficiency and effectiveness. Combining public (secondary) and private (primary) data can provide insights to make decisions, as when the Tampa Bay Buccaneers used public geodemographic information to help set prices and target customer segments. This chapter provides a good explanation and case study for A/B testing.

Digital Media Analytics

Duke University serves its huge fan base through its crowdsourced data visualization platform know as #DukeMBBStats. Ryan Craig provides an engaging explanation of the process Duke followed to grow the platform. Ryan’s chapter (8) offers direction for other NCAA and pro organizations to create fan profiles to authentically and personally engage fans with effective marketing strategies to enhance renewals.

Michael Lorenc and Alexandra Gonzalez present a fascinating chapter (9) on leveraging digital marketing to drive revenue, relying on data from their employer (Google) to paint a picture of today’s digital buyer. Evidence shows the potential ROI on digital marketing informed by audience, acquisition, and behavioral and conversions data via Google Analytics. You’ll be analyzing your own website and digital marketing before you finish the chapter.

Sponsorship Valuation & Affinity Groups

 Adam Grossman and Irving Rein provide one of the best summaries I’ve read on the state-of-the art in sponsorship valuation. [dropshadowbox align=”right” effect=”lifted-both” width=”200px” height=”” background_color=”#ffffff” border_width=”1″ border_color=”#dddddd” ]”Where audience analysis often fails is the inability to recognize that it is never static.” ~Grossman & Rein[/dropshadowbox] The authors provide descriptions of inherent valuation (profits generated by sponsorship assets), relative valuation (comparing CPMs across channels), and comparable valuation (comparing the price of assets offered by different properties), as well as how best to communicate to particular audiences. In addition to teaching at Northwestern (along with Professor Rein), Adam founded Block Six Analytics, using analytics and technology to help brands and teams generate revenue.

Co-editor C. Keith Harrison of the text, along with Suzanne Malia Lawrence, introduce the concept of “live analytics” in Chapter 11 to study and understand affinity groups and develop marketing plans accordingly. Live analytics, in this case, means distributing surveys during events, collecting and analyzing the results, and then creating innovative ways to engage fans. They provide an example of the Gridiron Girls football clinic at Montana State University. Another good example at the pro level is the Dallas Cowboys 5-Points Blue designed for female fans, based on extensive primary research and analysis of other NFL teams to differentiate the affinity group.

5 Points Blue

Talent Analytics & Data-Driven Storytelling

Brandon Moyer explains how the Aspire Group and others use analytics to hire and develop talent in the business of sports.  At Aspire, they look for employees with WHOPPPP:

  1. Work ethic
  2. Honesty, integrity & character
  3. Openness to learning
  4. Passion for sport business & sales
  5. Production (results)
  6. Positive attitude
  7. Potential for leadership

This chapter (12) provides other examples of how teams and companies (should) use data-driven approaches to hire and evaluate personnel.

Ryan Sleeper illustrates a variety of data visualization approaches to enhance storytelling–or communication–with the intended audience in Chapter 13. Effective visualization reduces time to insight, increases accuracy and improves engagement. The lesson here, again, is: Keep it simple. Ryan offers engaging examples of how to hook an audience–like converting a league standings table into a map to quickly gauge relative team performance. See more of his Tableau tips at his website. While we are at it, we strongly recommend taking a course in Tableau if your goal is to succeed in the business of sports.

Conclusion

Michael Mondello provides a concluding chapter on how to teach a sports business analytics course. Dr. Mondello provides helpful examples of his approach to class relative to content delivery, class assignments,  and exams.

The approach in the Sport Sponsorship & Sales (S3) program is to combine the Sport Business Analytics text (most Mondays) followed by lab instruction (most Wednesdays) using Microsoft Dynamics 365 to learn CRM and marketing automation processes reliant upon analytics. Microsoft IT Imagine Academy provides video instruction for learners at member Microsoft Dynamics Academic Alliance schools. Code Academy offers free courses on related data management topics, such as SQL.

To assist others using the text, below is a list of key terms for each chapter. To give the reader of this review an idea of the concepts and content, the first and last chapter are complete with definitions. The first chapter outline also provides tips on studying, just in case some students are still trying to figure that out. Other chapters contain key terms/concepts only. Feel free to download, edit and use for your own class purposes.


Chapter: Topic
Chapter 1 Evolution and Impact of Business Analytics in Sport
Chapter 2 Analytics and Ticketing Innovations at the Orlando Magic
Chapter 3 Ticket Markets in Sport
Chapter 4 CRM & Fan Engagement Analytics
Chapter 5 Ticket Marketing Sales and Service Philosophy
Chapter 6 Empirical Research Methods
Chapter 7 Data Driven Marketing Initiatives
Chapter 8 Fan Engagement Social Media Digital Marketing Analytics Duke
Chapter 9 Leveraging Digital Marketing to Engage Consumers and Drive Revenue
Chapter 10 Communicating the Value of Sports Sponsorships
Chapter 11 Market Research Analytics
Chapter 12 Talent Analytics
Chapter 13 Visualization is the Key to Understanding Data