Selling Experiences Online: Announcing the BAV-S3 4V® Brand Index

Selling Experiences Online: Announcing the BAV-S3 4V® Brand Index
by Kirk Wakefield – June 2016

Juniper Research classifies ticketing as one of the primary commerce applications driving eCommerce, estimating over one-fourth of ticket purchases will go mobile in the U.S. by 2020, and over half of ticket purchases outside of the US and Europe to be mobile-based by 2020. Teams like the Portland Trail Blazers renew season tickets via mobile devices and continue to see fans more comfortable in making both small and large transactions on mobile apps.

While we in the U.S. may think life moves at the speed of digital, we move at a snail’s pace compared to the growth in China, where the average consumer spends 45 hours online a week (10+ over global average). B2C e-commerce in China is expected to grow at a 30% clip from 2016-2020. As sports-related brands seek a global presence (like Barcelona and Real Madrid), teams and vendor partners must focus on engaging fans in the ways fans desire, rather than only what is expedient or profitable in the near term.

The quality of the consumer experience with the brand in online ticketing will determine the winners and losers as the world turns increasingly mobile. How do we know who’s winning? Who’s winning so far?

The BAV-S3 4V® Brand Index

The BrandAsset Valuator (BAV®) database is the largest and leading quantitative, empirical study of brands and consumers. Spanning 16 years, 51 countries, and over 680,000 respondents, BAV is the world’s largest database of brand perceptions; containing ratings on over 43,000 brands on 72 dimensions.

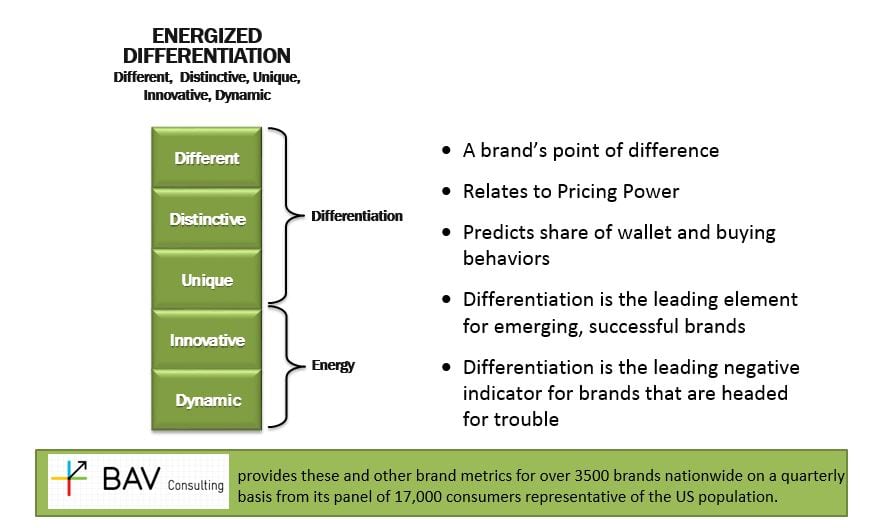
In collaboration with BAV, we developed the S3 4V ® Brand Index that evaluates online brands in terms of three positive dimensions of value, vision, and social vibe and one negative dimension of vanity. Customers favor online brands that demonstrate:

  1. Value: The leader, the best brand online characterized as (having)
    1. good value and worth more,
    2. trustworthy and reliable,
    3. simple and straightforward,
    4. high quality and high performance,
    5. original, authentic, down to earth and traditional
  2. Vision: The progressive, innovative, up-to-date, intelligent, visionary brand that is gaining in online popularity.
  3. Social Vibe: The brand that represents a fun, social, friendly, and charming online persona.

Customers discount or disfavor brands trying to score style-points without substance. Online visitors pick up on signs of Vanity, characterized as attempts to appeal to the upper class on the basis of glamour, style, prestige, sensuality, and trendiness. We find this has a negative effect on regular brand usage.

Together, these four dimensions explain over 50% of consumer usage of the brand. That amount of variance is another important V to consider as brand compete to win customers to their online real estate.

The Winners

The 4V Brand Index covers 278 brands that offer some form of online experience across a dozen sectors. Our index places weights on each of the four Vs in an equation that best predicts brand usage. Scores range from Amazon on the high end (29.02) to ISIS (-7.24) on the low end. Sectors include mobile phones, with iPhone and Samsung Galaxy outclassing all other comers by large margins. More interesting is competition among mobile payment vendors (Amazon Local Register vs. Apple Pay vs. Square), internet tools and services (Google Maps vs. MapQuest), or social media (how is Snapchat doing against Facebook, Twitter and LinkedIn?).

But, since we’re all about sports first, that’s where we will begin. The table may be sorted based on the overall index score or each of the 4Vs.

[table id=4 /]

Ticket sellers

Although tickets are only a part of their businesses, eBay and Groupon lead the way in offering online experiences that customers perceive as offering value, vision, and vibe that outweigh attempts to appeal to the vanity of buyers. Given shopper motives for buying online, the strongest predictor of brand usage in our equation is value, followed by brand vision.

Between the two leaders in ticket sales online, eBay’s subsidiary, StubHub (8.56) performs better than Ticketmaster (7.13), primarily due to vision (13.29 vs. 10.52) and social vibe (12.61 vs. 10.54) customers get when they visit their websites or use their mobile apps.

In the future, we will add SeatGeek and VividSeats to the index, two ticket sellers with significant investments in online and mobile ticket distribution.

The Losers

Fan Duel and Draft Kings suffer from high vanity scores and low value scores. Being new and on the cutting edge (vision) helps attract customers, but a brand’s longevity is in question if it cannot deliver value.

On a broader scale, sports teams must be mindful of partnering with online brands with negative personas. The two lowest rated online brands (ISIS and Al Jazerra) clearly aren’t potential partners, but not far behind are Foursquare (4V = .13) and Tinder (4V = .18). Granted, these might target specific fan segments, but the signal sent to all customers may not bode well for the team and its other brand partners. Brands with relatively low 4V scores may be due to overall low market strength and penetration. Customers don’t necessarily hold negative perceptions, but may hold no perceptions at all about the brand.

Looking forward

In future analyses, we will take a closer look at ticket sellers to examine the specific features and drivers of customer online experiences.

CRM & Sales: Redefining Hustle

CRM & Sales: Redefining Hustle
by Erin Quigg – June 2015

Redefining “Hustle”

How do you measure a salesperson’s hustle? From an activity-based and CRM standpoint, is it the number of tracked phone calls, emails, and appointments in a week? What about LinkedIn InMail, Social Media, and text messaging? With the amount of different communication methods available now, does it matter what communication medium salespeople use as long as they are moving prospects through the pipeline and closing sales?

This past season we redesigned our Ticket Sales’ hustle metric by shifting the focus from activity-based performance to pipeline management. Our main objective was to let the reps sell the way that works best for them and their customers. To accomplish this objective, we wanted the reps to focus on advancing quality leads closer towards a sale, rather than hitting certain activity based quotas. Additionally, we wanted our reps to view and utilize CRM as a sales management tool and less like a simple correspondence tracking system.

Going from Quantity to Quality

[dropshadowbox align=”right” effect=”lifted-both” width=”395px” height=”” background_color=”#ffffff” border_width=”1″ border_color=”#dddddd” ]“Our new effectiveness metric has been transformational in refocusing sales reps on engaging high-quality customers and building out their pipeline rather than achieving phone call and other activity-based benchmarks.” – Jay Riola, Assistant Director of Business Strategy, Orlando Magic [/dropshadowbox]

Old Metrics:

  • Phone Calls
  • Completed Appointments
  • Referrals
  • Talk-time
  • Hand-written notes
    [dropshadowbox align=”right” effect=”lifted-both” width=”395px” height=”” background_color=”#ffffff” border_width=”1″ border_color=”#dddddd” ]There is a “direct correlation between effective pipeline management and strong revenue growth.” – Harvard Business Review, Companies with a Formal Sales Process Generate More Revenue[/dropshadowbox]

New Metrics:

  • Completed Appointments
  • Pipeline Growth through Personal Prospecting
  • Pipeline Advancement

How does it work?

  • Score – Each metric is weighted with a certain value. For example, a completed appointment is 25 points, a personally prospected sales opportunity is 2 extra points, and each positive movement through the pipeline is weighted by stage and product.
  • Competition – Weekly, the reps compete against one another to get the highest score. The reps are then ranked, top half are winners and bottom half are losers. Over a certain period of time, the reps keep a win-loss record and prizes are given for the top performers.

Conclusion

It’s been four months since we redesigned the hustle metric and already our sales reps are better at utilizing our CRM as a sales tool. They have even started asking for more data on how to streamline their sales efforts. The Ticket Sales management team has done a great job in assisting the sales team with pipeline management by leveraging our pipeline and appointment reports. Having leadership adopt and support this new philosophy has helped the implementation and success of the program measurements as a whole.

In the end, activities are still important because those interactions are how prospects are engaged, qualified, and moved through the sales funnel; but instead of being measured on how many calls a rep can make in a week, we measure our reps on how efficient they are in closing a sale and generating revenue, which is their main responsibility at the end of the day.

How can properties support sponsorship rate cards?

How can properties support sponsorship rate cards?
by Kirk Wakefield – January 2014

Is sponsorship more about media or meaning?

Why should brands pay for the rights to be an anchor sponsor of an NFL, MLB, or NASCAR property? Can these properties defend their rate cards that afford brands the rights to communicate with their fans via the property’s venue, television, radio, website, social media, special events, and logos/marks?

anne rivers“We have been very successful showing the success of sponsorship to build brand equity, and in turn firm value, which has been harder for those trying to use impressions to capture ROI.” ~Anne Rivers, SVP, Global Director of Brand Strategy, BAV Consulting

Sponsorships activate the brand in the minds of passionate fans across multiple channels to achieve brand objectives. If it were just about buying media and exposures to gain a particular audience, there are typically cheaper (CPM) options than sponsorships. But, exposures can be important, because it gives some idea about the potential to reach passionate fans. What it doesn’t tell us is if they are paying attention.

So, the question becomes less about media and more about meaning.

Brand managers are smart. They know single exposures (or even a few) of a brand message have no meaningful impact on consumers. They know people pay more attention when they are highly engaged and passionate, which is what people are about their favorite sports, teams, and players. They also know consumers think, feel, and act more positively toward a brand if the message is received and reinforced through multiple channels.

This brings us to the sponsorship question of the day: Is paying the property for the rights to use their assets worth it?

Evidence for rate card support

[dropshadowbox align=”right” effect=”lifted-both” width=”350px” height=”” background_color=”#ffffff” border_width=”1″ border_color=”#dddddd” ]
matt webb“Brands have had an overwhelmingly positive response to our analytical approach to measurement. Our ability to provide our partners with measurable, goal-oriented results is invaluable and allows us to truly be a solutions provider.” ~ Matt Webb, Director, Corporate Partnerships, Cleveland Browns[/dropshadowbox]After years working with brands such as AT&T, TXU Energy, HEB, and a variety of other brands in cooperation with The Marketing Arm, this past year I began working with clients in NASCAR, MLB, and the NFL to determine if anchor sponsors receive more bang for the buck than mid or lower level sponsors.

We learned two simple lessons that we’ll complicate with colored charts and graphs.

#1 Attendance means nothing. Engagement means everything.

Fans can spend up to 36 hours over three days at a NASCAR racing event. And many do.  But the number of hours at the track has no significant correlation with whether or not fans recognize the activation of brands like Ford, Coke, Sprint, and SpeedTV. Instead, it’s the frequency of engagement with sponsors–which we measured using RFID tags connecting fans with sponsor activation locations–that predicts whether or not fans distinguish the brand as a sponsor and not its competitors.

bav#2 More channels increase relative brand equity.

With our partner, BAV Consulting, we measure a brand’s energized differentiation (see inset) for not only the sponsor, but also competing brands who may be sponsors or ambushers. In short, sponsors routinely outperform non-sponsors (see our MIT Sports Analytics paper). But, what about anchor sponsors versus secondary sponsorships?

Working with our NFL and MLB team partners, we compare multiple categories of anchor versus secondary sponsors in terms of fans’ recognition of the sponsors’ use of property assets: stadium signage, stadium messages, special game promotions, website, social media, television, radio, and use of team marks in advertising/POP.

If you’re the kind of stats nerd that attends and understands the data analytics presentations at the MIT or Wharton conferences where we’ve presented, then the charts below are for you. If not, here it is in words:

  1. Activation not exposures. How often the fan attends, watches or listens to games increases the odds of recognizing the brand’s sponsorship activation (the green boxes), but does not have a direct effect on the brand’s energized differentiation (the red boxes). This reinforces our NASCAR findings: Just being there doesn’t count. The brand must be activated in the minds of the fans.

    meaning not media
    Table 1
  2. Multi-channel communication. The greater the multi-channel activation among the property’ eight assets, the greater the energized brand differentiation of the sponsor (dark green boxes).
  3. Anchors = activation. Fans recognize anchor sponsor communications across more channels than they do for mid-level or low-level sponsors in the same categories (tan boxes). In other words, the additional assets pay off with greater activation of the brand among fans.
  4. Brand equity effects. For the eight categories we tested, each additional effective channel increases energized brand differentiation by 6-7% (the regression equation in Table 2 is an example of one anchor sponsor for the NFL team). Overall, the number of effective channels explains over 90% of a brand’s asset value in the minds of fans. This is a big number.

    Table 2
    Table 2

Conclusion

Some might still say, “So, what? Where’s the big payoff?” We’re glad you asked.

Consistent with our findings in each category, the chart below shows what happens to market share among those fans who recognize activation across multiple channels between the anchor sponsor and the low-level sponsor in the same category.

Both sponsors are national brands with otherwise strong brand equity according to BAV Consulting. But, the payoff for being the anchor sponsor for the NFL team brings substantive market share increases (4.4% ) for each additional effective channel.

If your team or brand would like to learn more, please tweet (@kirkwakefield) below or email. Happy to help!

market share

Three Steps to Creating an Effective Entry-Level Sales Contest

Three Steps to Creating an Effective Entry-Level Sales Contest
by Brian Norman – August 2013

“If you don’t know where you’re going, any road will take you there.”

Think about a sales contest you have conducted (or participated in) that was missing something. Perhaps it did not have a specific purpose, was unorganized, anticlimactic, or even ineffective?  Rather than using a generic model, create a personalized strategy that will help your team accomplish its goals. 

Step 1: Set Specific Objectives

The first step in designing an effective sales contest is to determine the ultimate objective.  Goals for entry-level sales staffs can vary; therefore it’s imperative to set specific objectives for your sales contest.  Write down, in detail, what you hope to accomplish and how you will measure your success.

Questions that need to be answered include:

[dropshadowbox align=”right” effect=”lifted-both” width=”250px” height=”” background_color=”#ffffff” border_width=”1″ border_color=”#dddddd” ]

Jake Reynolds
Jake Reynolds

“An effective sales contest, done the right way, can produce big results for your team.

The preparation leading up to it, the execution throughout and the post contest assessment are all vital in maximizing the results from your contest. In order to get the desired outcome when building the sales contest, it’s important that it’s designed to help accomplish a specific agenda, create a fun and competitive environment, engage your employees and drive big revenue.”wizards_alt_logo_hand [/dropshadowbox]Are you basing the contest solely on revenue production?

  • Are you trying to increase departmental revenue by 10%, 25%, 50%?
  • Is there a specific team revenue goal you’d like to reach?
  • Historically, what was produced during this period of the sales cycle?

Are you focused strictly on moving inventory – regardless of revenue?

  • Is there specific inventory you’re focused on selling (club seats, VIP seating, etc.)?

Are you also focusing on increased call volume, on-site appointments, or other “hustle” metrics?

  • If so, do all of these metrics directly contribute to your ultimate goal?
  • Are these metrics readily accessible throughout the day to encourage/drive individuals?

Step 2: Design the Program

Establish each of these for every sales contest.

Team, Individual, or Both?

Recognize when it’s most effective to use a team-based contest versus an individual-based contest. 

  • A team contest will help drive departmental unity.  In theory, every member of your team will work together to accomplish the goal to receive some type of incentive.  In reality, be aware of free-loaders who don’t contribute and seek the same incentive as the rest of their team.  To address this, set personal “minimum qualifiers” to motivate everyone on the team to participate.
  • Is your sales group full of competitive, result-driven employees?  If so, an individual-based contest may be the best route for your team.   Create and facilitate a program that will bring out the competitive nature of your sales team as they compete against one another.
  • Sales contests can also tie in both team and individual aspects that will build team unity while rewarding top performers.  Focus on dynamics that will motivate the team as a whole, while also pushing individual performance within the contest.  An overall team incentive can be supplemented by smaller prizes throughout the contest to key performers. 

Theme

In order to keep your team engaged throughout your sales contest, it’s crucial to design your sales contest around an exciting and entertaining theme.  Whether you use current events (Olympic Games, March Madness, Draft Lottery), movies (Fight Club) or board games (Monopoly, Scrabble) to model the contest, it should be creative, fun, and most of all, engaging!

Time frame

The length of the sales contest is one of the most important pieces of the design.  If your contest is too short, it may not give your sales team the proper time to accomplish the set objectives.  If your contest is too long, your objective will lack urgency and it can grow stale.  Refer to previous sales/hustle metrics to determine the appropriate timeframe to accomplish your objectives.

Incentives

What will truly motivate your team to increase their performance?  Simply ask them!  By [dropshadowbox align=”right” effect=”lifted-both” width=”250px” height=”” background_color=”#ffffff” border_width=”1″ border_color=”#dddddd” ]

Eric Platte
Eric Platte

“After running plenty of sales contests that produced different results, the underlying factor that motivates everyone is free and simple: recognition.

For example, the 2013 Final Four was in Atlanta so we capitalized with a sales contest. The winning member received two tickets to the tournament, assorted gift cards, in addition to a trophy and picture that we sent to the NBA league office and our executive team. After the hundreds of dollars we spent on the prizes, the winner was most proud of the email we sent to the league and the executive team with his picture!”hawks_50t [/dropshadowbox]asking your sales team what incentives they desire most, you’re accomplishing two things:

First, and most obvious, you’re able to put together a list of incentives they desire.  Send out an email asking your team to present you with three items (under your set budget) that they would love to have.  Whether its cash, gift cards, concert tickets, autographed memorabilia, or other prizes, you’re sure to get authentic feedback.  (Best answer to date: C.R.E.A.M: Cash rules everything around me!)

Secondly, and just as important, you’re empowering your employees with the task of helping design their very own sales contest.  This leads to increased buy-in and appreciation from your team.  Further, you are presented with ideas you never would have thought of yourself.

Step 3: Review, Recap, Revise

What could have been done better?

  • Was the contest too long? Too short?
  • Was your sales team engaged? What could you have added to make it more engaging?
  • Did the original rules work throughout, or did you have to adjust them at some point? Why?
  • Did the incentives actually motivate your sales team, or were they simply a nice reward?
  • How close did you come to accomplishing your goals? Were the goals too easy? Too hard?

Analyzing Metrics

Simply put, did the contest accomplish your set objectives?  Compare your team’s performance during the contest against previous data to measure the true impact.  Record your results as they compare to historical metrics and save for future referral.

Finally, measure your team’s output over the weeks and months following your contest to gain additional insight into the contest’s level of effectiveness.

  • How much revenue was produced compared to last month?
  • How much revenue was produced compared to the same time in the selling cycle last year?
  • What percentage of sales was from the targeted inventory?
  • How does outbound call volume compare to the average call volume for the last week? Month?