

by Kirk Wakefield – January 2014
Is sponsorship more about media or meaning?
Why should brands pay for the rights to be an anchor sponsor of an NFL, MLB, or NASCAR property? Can these properties defend their rate cards that afford brands the rights to communicate with their fans via the property’s venue, television, radio, website, social media, special events, and logos/marks?
 “We have been very successful showing the success of sponsorship to build brand equity, and in turn firm value, which has been harder for those trying to use impressions to capture ROI.” ~Anne Rivers, SVP, Global Director of Brand Strategy, BAV Consulting
Sponsorships activate the brand in the minds of passionate fans across multiple channels to achieve brand objectives. If it were just about buying media and exposures to gain a particular audience, there are typically cheaper (CPM) options than sponsorships. But, exposures can be important, because it gives some idea about the potential to reach passionate fans. What it doesn’t tell us is if they are paying attention.
So, the question becomes less about media and more about meaning.
Brand managers are smart. They know single exposures (or even a few) of a brand message have no meaningful impact on consumers. They know people pay more attention when they are highly engaged and passionate, which is what people are about their favorite sports, teams, and players. They also know consumers think, feel, and act more positively toward a brand if the message is received and reinforced through multiple channels.
This brings us to the sponsorship question of the day: Is paying the property for the rights to use their assets worth it?
Evidence for rate card support
[dropshadowbox align=”right” effect=”lifted-both” width=”350px” height=”” background_color=”#ffffff” border_width=”1″ border_color=”#dddddd” ]
 “Brands have had an overwhelmingly positive response to our analytical approach to measurement. Our ability to provide our partners with measurable, goal-oriented results is invaluable and allows us to truly be a solutions provider.” ~ Matt Webb, Director, Corporate Partnerships, Cleveland Browns[/dropshadowbox]After years working with brands such as AT&T, TXU Energy, HEB, and a variety of other brands in cooperation with The Marketing Arm, this past year I began working with clients in NASCAR, MLB, and the NFL to determine if anchor sponsors receive more bang for the buck than mid or lower level sponsors.
We learned two simple lessons that we’ll complicate with colored charts and graphs.
#1 Attendance means nothing. Engagement means everything.
Fans can spend up to 36 hours over three days at a NASCAR racing event. And many do. But the number of hours at the track has no significant correlation with whether or not fans recognize the activation of brands like Ford, Coke, Sprint, and SpeedTV. Instead, it’s the frequency of engagement with sponsors–which we measured using RFID tags connecting fans with sponsor activation locations–that predicts whether or not fans distinguish the brand as a sponsor and not its competitors.
 #2 More channels increase relative brand equity.
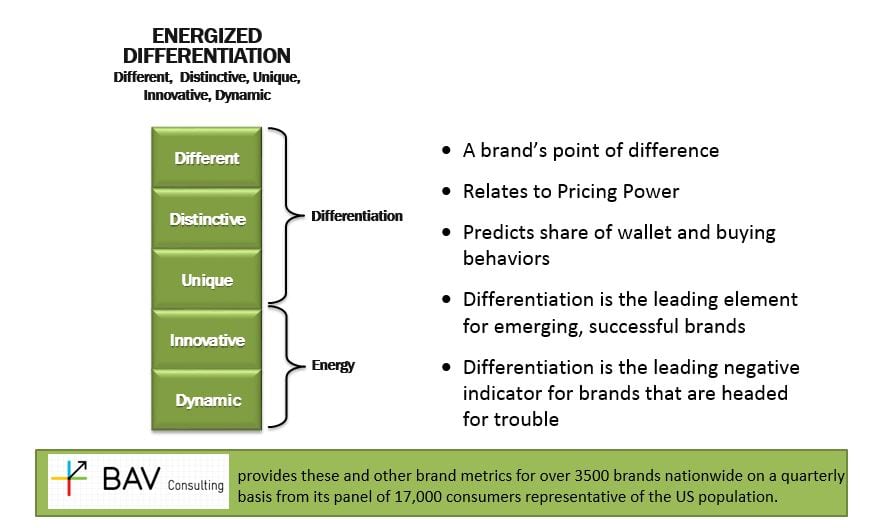
With our partner, BAV Consulting, we measure a brand’s energized differentiation (see inset) for not only the sponsor, but also competing brands who may be sponsors or ambushers. In short, sponsors routinely outperform non-sponsors (see our MIT Sports Analytics paper). But, what about anchor sponsors versus secondary sponsorships?
Working with our NFL and MLB team partners, we compare multiple categories of anchor versus secondary sponsors in terms of fans’ recognition of the sponsors’ use of property assets: stadium signage, stadium messages, special game promotions, website, social media, television, radio, and use of team marks in advertising/POP.
If you’re the kind of stats nerd that attends and understands the data analytics presentations at the MIT or Wharton conferences where we’ve presented, then the charts below are for you. If not, here it is in words:
- Activation not exposures. How often the fan attends, watches or listens to games increases the odds of recognizing the brand’s sponsorship activation (the green boxes), but does not have a direct effect on the brand’s energized differentiation (the red boxes). This reinforces our NASCAR findings: Just being there doesn’t count. The brand must be activated in the minds of the fans.

Table 1 - Multi-channel communication. The greater the multi-channel activation among the property’ eight assets, the greater the energized brand differentiation of the sponsor (dark green boxes).
- Anchors = activation. Fans recognize anchor sponsor communications across more channels than they do for mid-level or low-level sponsors in the same categories (tan boxes). In other words, the additional assets pay off with greater activation of the brand among fans.
- Brand equity effects. For the eight categories we tested, each additional effective channel increases energized brand differentiation by 6-7% (the regression equation in Table 2 is an example of one anchor sponsor for the NFL team). Overall, the number of effective channels explains over 90% of a brand’s asset value in the minds of fans. This is a big number.

Table 2


Conclusion
Some might still say, “So, what? Where’s the big payoff?” We’re glad you asked.
Consistent with our findings in each category, the chart below shows what happens to market share among those fans who recognize activation across multiple channels between the anchor sponsor and the low-level sponsor in the same category.
Both sponsors are national brands with otherwise strong brand equity according to BAV Consulting. But, the payoff for being the anchor sponsor for the NFL team brings substantive market share increases (4.4% ) for each additional effective channel.
If your team or brand would like to learn more, please tweet (@kirkwakefield) below or email. Happy to help!

